


Benchmarking helps you determine where your brand stands compared to competitors in the same segment and identify areas for improvement. However, if you observe the wrong competitors or compare metrics that aren’t comparable, the results could lead you to make inaccurate business decisions.
This article guides you through benchmarking your beauty brand on e-commerce platforms: from selecting the right group of competitors and identifying key metrics to track, to establishing a comparison process and prioritizing issues that need to be addressed.
Why Benchmarking Your Beauty Brand Often Goes Wrong
A competitor slashes prices during a flash sale, so you consider following suit. They frequently appear on social media, so you start thinking about increasing your influencer budget. But is what works for them truly the right fit for your brand?
Benchmarking is different from simply analyzing competitors’ activities in general. This method focuses on comparing relevant metrics to determine your brand’s position within a relevant group of competitors.
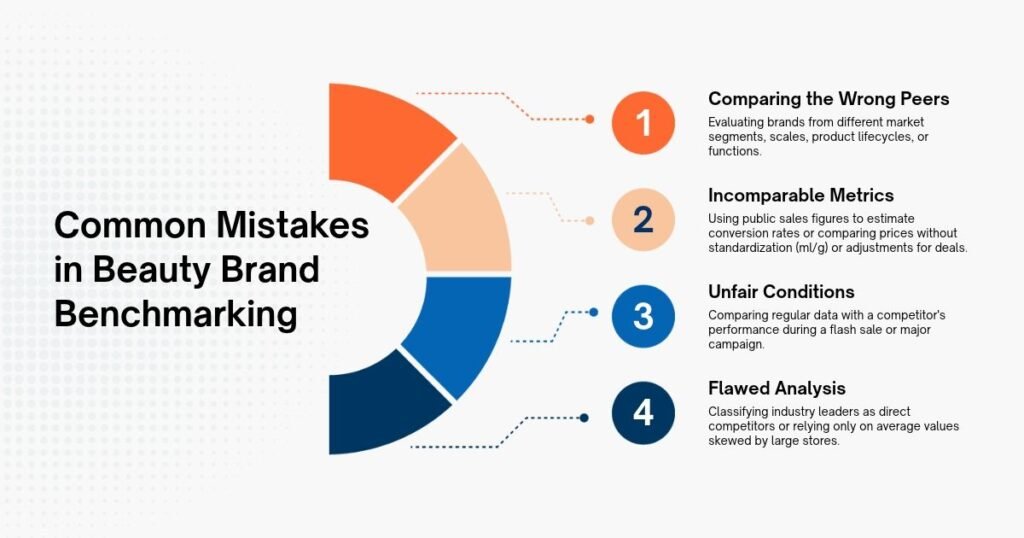
The following three mistakes can render benchmarking results meaningless:
- Using competitors from a different market segment as a benchmark. An emerging domestic brand specializing in vegan serums would struggle to accurately assess its position if it used the sales figures of a multinational corporation with multiple mass-market brands as a benchmark. Even though both sell cosmetics on the same platform, they may differ significantly in price tier, scale, and customer base. Therefore, the sales figures of a large brand are not necessarily an appropriate benchmark for a smaller brand.
- Comparing metrics that aren’t on the same basis. For your own store, you can view traffic, orders, and conversion rates in your internal seller reports. However, your competitors’ publicly available data typically only shows the number of sales, customer reviews, or product rankings. The number of sales doesn’t indicate how many people viewed the product but didn’t buy it, so you can’t use this metric to conclude which store has a better conversion rate.
- Comparing data collected under different conditions. You’re analyzing your store on a regular day, while your competitor’s data was collected right after a major sale. The difference in sales at this point may stem from promotions and does not necessarily reflect a consistent difference between the two brands. If you ignore the timing of the data collection, you might lower prices or increase your advertising budget based on an unfair comparison.
How to Choose the Right Peers for Beauty Brand Benchmarking
The group of brands selected for comparison is called a peer group – a collection of brands that are sufficiently similar for you to meaningfully assess your own position.
Three Roles in Your Comparison Set
Not every brand worth tracking should be included in the same benchmarking group. Distinguish between the following three roles:
- Benchmark peers: Brands that are similar in product segment, price tier, and scale. This is the group you use to determine your current position and identify areas for improvement.
- Industry-leading brands to learn from: Larger brands that can serve as references for how to build product listings, run promotions, or expand your product catalog. If the scale difference is too great, track them separately rather than including them in the group used to assess your position.
- Indirect competitors to monitor: Brands that address the same need with different products, such as acne patches and acne-treatment serums. You can learn from how they approach customers, but you shouldn’t classify them as direct peers.
Four Filters for Choosing Comparable Beauty Brands
When selecting direct peers, consider the following four criteria.
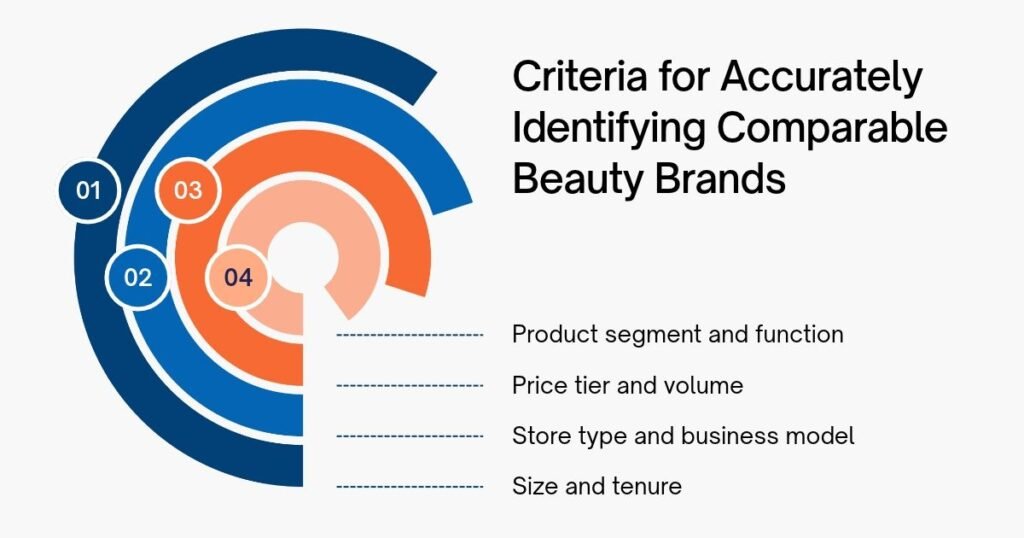
- Product segment and function: Retinol serums and vitamin C serums both fall under the skincare category but serve different purposes. Simply belonging to the same category is not enough to conclude that two products are suitable benchmarks for each other.
- Price tier and volume: Standardize prices to the same unit (such as price per milliliter or gram) before comparing. For products with coupons or bundles, record both the listed price and the discounted price separately to determine the product’s actual price tier.
- Store type and business model: On Shopee, stores may differ in terms of authenticity, distribution models, and competitive advantages. Prioritize stores with similar business models that target the same customer base as yours, rather than assuming that all stores within the same product category are directly comparable.
- Size and tenure: Sales figures and reviews are typically cumulative, so listings that have been active longer may have a natural advantage. Therefore, don’t compare a new listing that’s been active for six months with one that’s been selling for five years based solely on total sales or the total number of reviews.
Build a Peer Comparison Card
Record information about each store along with the reasons you selected them. This table helps you distinguish between the group used as a benchmark and brands you should simply monitor to learn from.
Brand / Store |
Role |
Store Type |
Price Tier |
Comparison Product |
Reason for Selection |
Shop A |
Peer |
Official store |
Mid-range |
Retinol serum |
Same function and price tier |
Shop B |
Industry leader to learn from |
Official store |
Higher |
Retinol serum |
Much larger scale; monitor separately |
Shop C |
Indirect competitor |
Top Seller |
Lower |
Acne patches |
Same need, different product type |
You can start with a small peer group. Only include shops that have a clear reason for being included in the comparison.
What Metrics Can You Fairly Benchmark?
When benchmarking a beauty brand against competitors, distinguish between public data on the marketplace and your shop’s internal KPIs. Public data helps you determine your relative position; internal KPIs help identify aspects of your business operations that require further review. These two sets of data complement each other but are not interchangeable.
Public Marketplace Metrics You Can Compare
This information is available on product pages or public shop pages. You should use the same metrics for both yourself and your competitors, and track the data over corresponding time periods.
For example, the “units sold” figure on your listing should be compared to the “units sold” figure on your competitor’s listing (not revenue or the number of orders in the seller’s internal reports). Shopee Business Insights can provide detailed information about your own shop’s performance, but that doesn’t mean you can view similar internal KPIs for your competitors.
Metric |
What Can Be Compared? |
Reliability and Notes |
Price |
List price and price per ml or gram |
Fairly high when standardized to the same unit. Record prices after applying vouchers or combo deals separately to reflect the actual price buyers may pay. |
Product range |
Number of SKUs sold and level of focus on flagship products |
Fairly high if using the same counting criteria. A broader product range does not necessarily equate to better business performance. |
Sales growth |
The difference in “units sold” between two reporting periods |
This is only an estimate, as publicly reported “units sold” may be cumulative figures. It is recommended to compare changes over equivalent time periods rather than just comparing total sales figures. |
Customer reviews |
Number of reviews, new reviews, average rating, and common complaints |
Depends on the data displayed and how it is collected. For cosmetics, pay attention to feedback regarding skin irritation, color discrepancies, leakage, or suitability for specific skin types. |
Listing content |
Claims about ingredients, skin concerns, certifications mentioned, images, and videos |
You can note the information appearing on the listing, but you cannot confirm from this alone that the claims are accurate or that the product is as effective as described. |
Promotions |
Types of publicly displayed offers, frequency, and timing |
Reliability depends on how the platform displays promotions and when the data is recorded. |
Shop service metrics |
Public metrics such as chat response rate or operating hours, if available |
Vary by platform and the information made public. Compare only metrics with the same definitions. |
When including metrics in a benchmarking table, record the source, collection date, and reliability level. This helps you distinguish between well-founded discrepancies and differences that may stem from data limitations.
Internal KPIs to Track Against Your Own History
E-commerce KPIs such as CAC, Blended MER, repurchase rate, return rate by SKU, and inventory turnover reflect internal business operations. Without corresponding data from competitors, you cannot directly compare these metrics between the two parties or infer them solely from sales figures, reviews, and publicly available information on the marketplace.
Instead, track your own KPIs over time, by traffic source, or by SKU to identify areas for improvement. Before comparing data across periods, standardize your definitions and calculation scope (especially if you sell on multiple marketplaces). For example, MER can yield different results depending on how revenue and marketing costs are defined.
You can also combine public data with internal KPIs to identify areas for investigation. If a listing shows lower sales growth than its peers, examine your store’s traffic, conversion rate, and repeat purchase rate. These metrics help pinpoint issues that need attention, but they’re not sufficient to determine why competitors are outperforming you.
Metrics Outside the Scope of Marketplace Benchmarking
Social media engagement, search engine interest, visibility in AI search engine answers, and sales from off-platform retail channels fall outside the scope of marketplace benchmarking. If reliable data is available, you can track these aspects separately, with clearly defined sources and measurement methods.
Share of Search is an example of a metric that must be considered within a specific context. This metric has been studied as a signal that can help predict market share, but one should not assume that the same methodology applies to every industry and market. If you want to use Share of Search to evaluate beauty brands in Southeast Asia, you need to verify the relevance of the search data and the market being analyzed before drawing any conclusions.
A Step-by-Step Framework for Competitive Benchmarking
Benchmarking isn’t more effective simply because you collect more data. What matters is choosing the right metrics, comparing on a level playing field, and using the results to inform a specific decision.
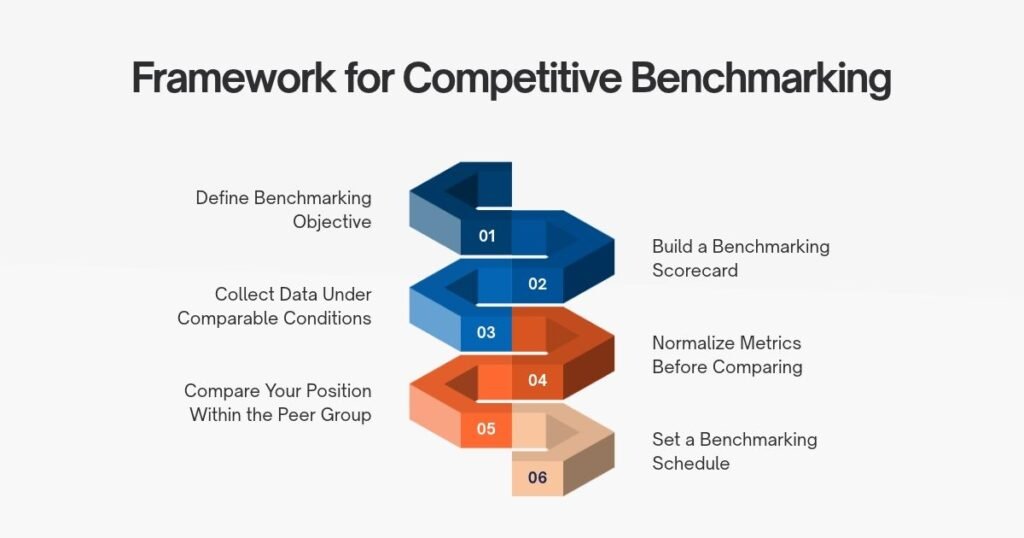
Step 1: Define Your Benchmarking Objective
Before collecting data, determine what decision you need the benchmarking to help you make: pricing a new product line, adjusting promotions, or understanding why reviews are growing more slowly than those of your competitors?
The more specific your objective, the easier it will be to select the right metrics to track and avoid wasting time measuring things that don’t support that decision.
Step 2: Build a Beauty Brand Benchmarking Scorecard
Create a scorecard with one row for each selected metric. The scorecard should display your data, the range of values within your peer group, your relative position, and the reliability of the data.
Metric |
Your Brand |
Peer Group Range |
Rank |
Reliability |
Price per 10 ml |
45,000 VND |
38,000–62,000 VND |
3rd out of 7, from lowest to highest |
High |
Number of SKUs currently for sale |
12 |
6–30 |
4th out of 7, from most to least |
High |
Increase in “units sold” over 4 weeks |
+900 |
+300 to +2,500 |
5th out of 7 |
Average |
New reviews in the past 4 weeks |
40 |
15–120 |
5th out of 7 |
Average |
Number of public promotions in the past 4 weeks |
3 |
2–9 |
6th out of 7 |
Low to average |
Note: The figures above are for illustrative purposes only, assuming your brand and six stores in the peer group; they are not actual market data.
The scorecard helps you see where you stand within your peer group. However, a low ranking does not automatically mean poor business performance. A brand with fewer SKUs than its competitors may still be on the right track if its strategy is to focus on a few key products.
Step 3: Collect Data Under Comparable Conditions
Record data for your store and each competitor during corresponding time periods, from the same type of public page. Keep a record of the collection date and any necessary evidence so you can verify the data if the figures change.
In particular, pay attention to promotional contexts. If your store is operating on a regular day while a competitor has just completed a major sale, the increase in “units sold” may not accurately reflect the difference between the two. Compare stores during comparable periods, such as during the same sale or during regular business periods.
Step 4: Normalize Metrics Before Comparing
Before ranking or calculating the gap, bring the data to a common measurement basis.
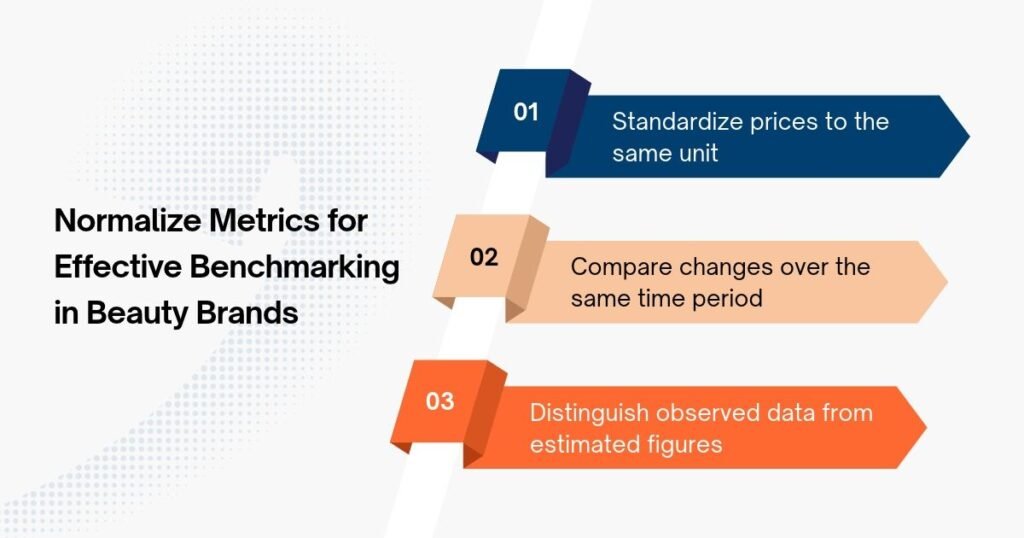
- Standardize prices to the same unit: Compare prices per milliliter or gram. Clearly indicate when you’re using list prices and when you’re using post-discount prices.
- Compare changes over the same time period: For “units sold” and reviews, compare the rate of increase between two points in time that are the same number of days apart, rather than just comparing cumulative totals. If the listing ages differ significantly, the average weekly growth rate can serve as a reference point, but it should not be considered an accurate measure of sales velocity.
- Distinguish between observed data and estimated figures: Publicly available “sold” counts may not accurately reflect the number of orders generated during a specific time period. Clearly state the limitations of the metric and avoid interpreting estimated figures as exact results.
Step 5: Compare Your Position Within the Peer Group
After standardizing the data, review the rankings and the low–high range to understand your position within the peer group. Do not rely solely on the average, as one or two shops that are significantly larger in scale may skew the average and make it unrepresentative of the majority of the group.
If the range of prices, sales volume, or size among stores is too wide, re-evaluate your peer group. You may be grouping brands from different market segments into the same group, making the comparison less meaningful.
Step 6: Set a Benchmarking Schedule
The frequency of benchmarking should align with your business decision-making cycle. If you review prices and promotions monthly, updating the benchmarking table monthly may be sufficient. If the market or product portfolio changes more rapidly, you may need to check more frequently.
In addition to a regular schedule, reassess whenever there are significant changes, such as after a major sale, when launching a new product, or when the peer group is no longer relevant.
How to Collect and Maintain Benchmarking Data
With a small peer group and a few basic metrics, you can start with a spreadsheet to test your approach and determine which data is truly useful. This method also helps you identify the data fields you need to track before investing in a more complex process.
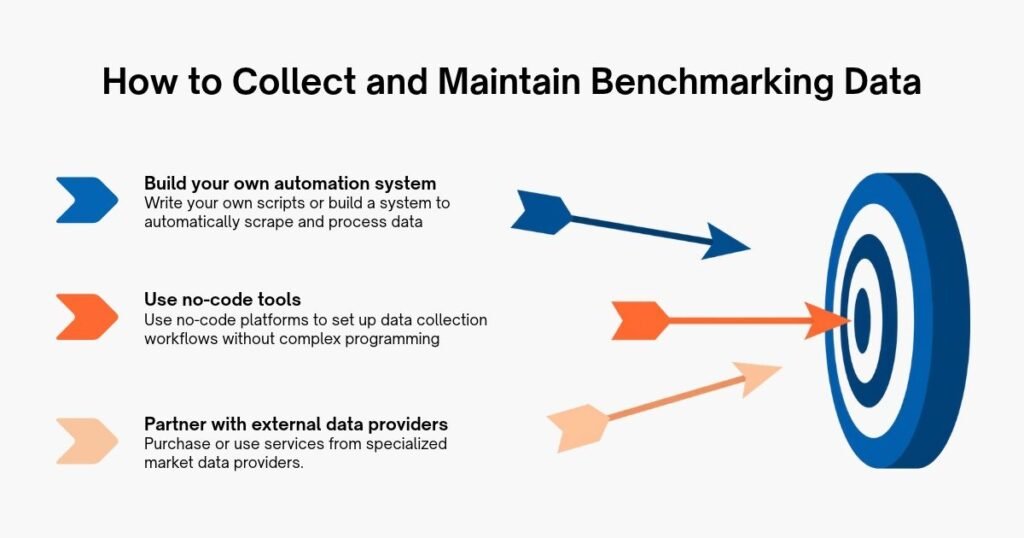
When you need frequent updates or need to track multiple products across multiple marketplaces, you may want to consider automating the collection process, using no-code tools, or working with an external data provider like Easy Data.
Whichever method you choose, be sure to document the source and time of data collection, and comply with each marketplace’s terms and conditions. If measurement methods vary between updates, it will be difficult to determine whether observed discrepancies reflect actual changes.
How to Identify and Prioritize Competitive Gaps
Just because you’re trailing a competitor on a metric doesn’t mean you need to find a way to improve that metric. First, determine where the gap comes from and whether closing it is truly important to your business goals.
Three Types of Competitive Gaps
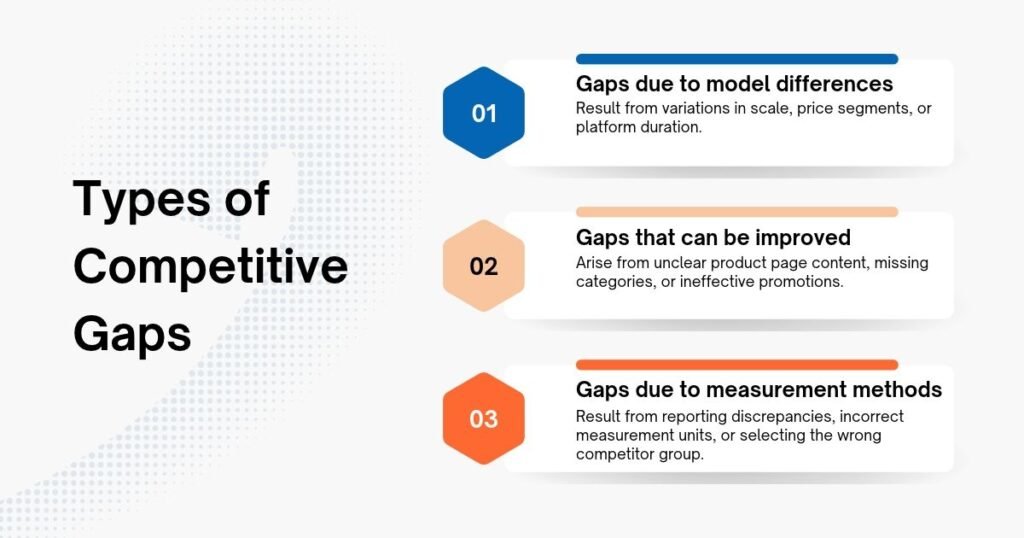
- Gaps due to model differences: Differences in scale, price tier, or market tenure are not easy to overcome, nor do they necessarily need to be. A small brand does not need to try to match the scale of a large competitor if it is competing in a different segment.
- Gaps that can be improved: Listings that aren’t clear enough, a product range that lacks suitable products, or ineffective promotional schedules are areas you can consider adjusting.
- Gaps due to measurement methods: If the discrepancy stems from differences in reporting timing, units of measurement, or comparison groups, correct the measurement method before making a decision.
Prioritize Gaps by Business Impact and Fixability
Prioritize gaps that directly impact your business goals and are within your ability to address.
Easy to Fix |
Difficult to Fix |
|
High impact |
High priority |
Consider long-term planning |
Low impact |
Address when resources are available |
Not a priority |
Example: Treat a Price Gap as a Hypothesis, Not a Conclusion
A brand in your peer group sells serum at a significantly lower price, even after adjusting for the same volume. That alone isn’t enough to conclude that they have lower costs than you.
Examine observable data, such as store type, post-discount prices, listed ingredients, and customer feedback. While this data may suggest possible explanations, it does not fully reveal your competitor’s production, distribution, or marketing costs. Therefore, don’t rush to lower your prices just because you see a competitor selling at a lower price.
Turn Benchmarking Results into Action
Suppose your listing has fewer new reviews than most of your peers. Instead of jumping to the conclusion that your product is less appealing, check the growth rate of reviews over the same period, then review your listing content and customer feedback on your own store. The results will help you identify the next steps to investigate or adjust, rather than acting solely based on rankings.
For each gap you choose to address, clearly document the issue, the planned actions, and the metrics you’ll use to evaluate the results. Gaps that don’t significantly impact your business goals can be monitored without immediately prioritizing resources.
What to Do Next
- Low sales: Read the article Why Your Beauty Products Aren’t Selling on Shopee to identify potential causes to investigate.
- Price discrepancies: Refer to How to Monitor Beauty Product Prices Like Top Brands.
- Promotional differences: Learn how to track competitors’ prices and promotions.
Final Thoughts
Benchmarking isn’t a race to top every metric. For beauty brands, the value of this approach lies in identifying which gaps truly impact competitiveness and selecting the right issues to address.
When you have the right peer group, consistent measurement methods, and results placed within a business context, you’ll have a better foundation for deciding what to change and what doesn’t need to be copied from competitors.
Leave a Reply