

The beauty industry has a clear characteristic: a brand’s growth does not only come from acquiring new customers, but also depends heavily on whether customers come back to buy again. Therefore, if a brand only looks at surface-level metrics such as traffic, number of orders, or ROAS, it is easy to get the impression that the business is growing well without knowing where that growth is coming from and whether it is truly sustainable.
In this article, Easy Data will show you 12 beauty ecommerce KPIs that serve as a basis for evaluating business health, helping you identify what is real growth and what is only growth on the surface.
Which KPIs Actually Show the Health of a Beauty Ecommerce Business?
There are many metrics to track in beauty ecommerce, but each one only reflects one part of the business. A beauty ecommerce KPI showing a good result does not necessarily mean the business is operating well. You need to analyze it together with related metrics to understand what is driving that result.
For example, CAC tells a brand how much it has to spend to acquire a new customer, but it does not tell whether that spending is actually effective. To evaluate this, CAC needs to be looked at together with conversion, order value, and the likelihood of customers coming back to buy again.
The same applies to other KPIs. ROAS can look good but still fail to accurately reflect marketing performance if multiple platforms claim revenue from the same order. Return Rate for the entire store can be within an acceptable range, while a specific SKU may have an unusually high return rate.
Therefore, instead of looking at each beauty ecommerce KPI independently, brands should read them as a system:
Customer acquisition cost → customer value generated → ability to repurchase → operational performance.
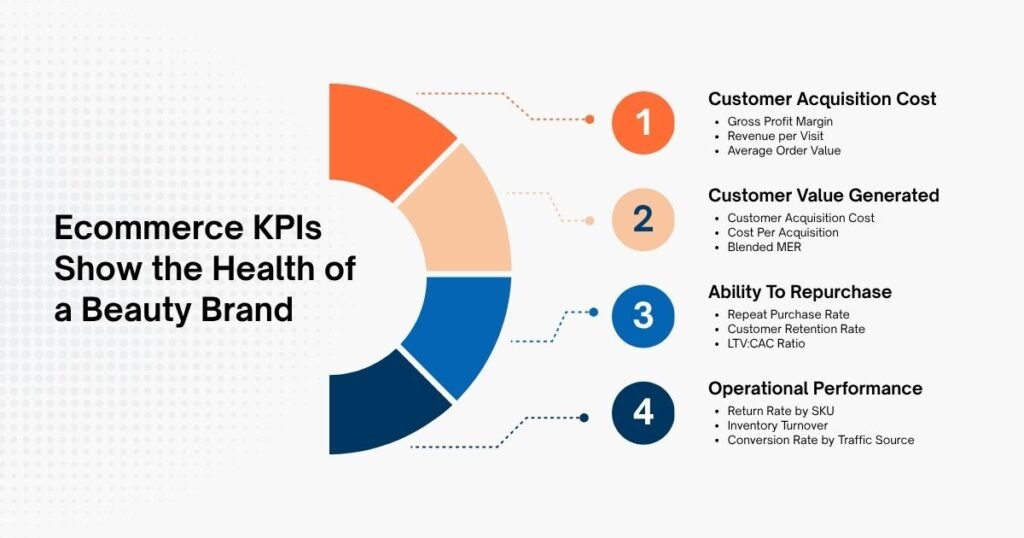
This way of looking at the metrics helps brands see deeper issues: whether the cost of acquiring new customers is reasonable, how much value each customer generates, whether customers come back, and where the problem lies in the operational process.
However, internal data alone is still not enough to know whether a KPI is actually good or bad. Brands need to put these metrics into the context of the market and compare them with brands in the same segment. This gives brands more basis to evaluate “where we are” and, more importantly, “whether that level is actually good enough.”
| KPI | Group | What It Measures |
| Gross Profit Margin | Financial & Revenue | % of gross profit remaining after COGS |
| Revenue per Visit | Financial & Revenue | Average revenue generated per visit |
| Average Order Value (AOV) | Financial & Revenue | Average value per order |
| Customer Acquisition Cost (CAC) | Customer Acquisition | Average cost to acquire one new customer |
| Cost Per Acquisition (CPA) | Customer Acquisition | Conversion cost by channel/campaign |
| Blended MER | Customer Acquisition | Marketing efficiency across the entire business |
| Repeat Purchase Rate (RPR) | Customer Retention | % of customers who have purchased at least twice |
| Customer Retention Rate | Customer Retention | % of existing customers retained during the period |
| LTV:CAC Ratio | Customer Retention | Ratio of customer lifetime value to acquisition cost |
| Return Rate by SKU | Operations & Product | % of returned orders, broken down by SKU |
| Inventory Turnover | Operations & Product | Number of inventory turns per year |
| Conversion Rate by Traffic Source | Operations & Product | Conversion rate by traffic source |
Group 1 — Financial & Revenue
This group of KPIs helps beauty brands answer one question: “How much real value is the revenue generating for the business?” It focuses on factors that directly affect profitability, such as margin, value per visit, and value per order.
1. Gross Profit Margin
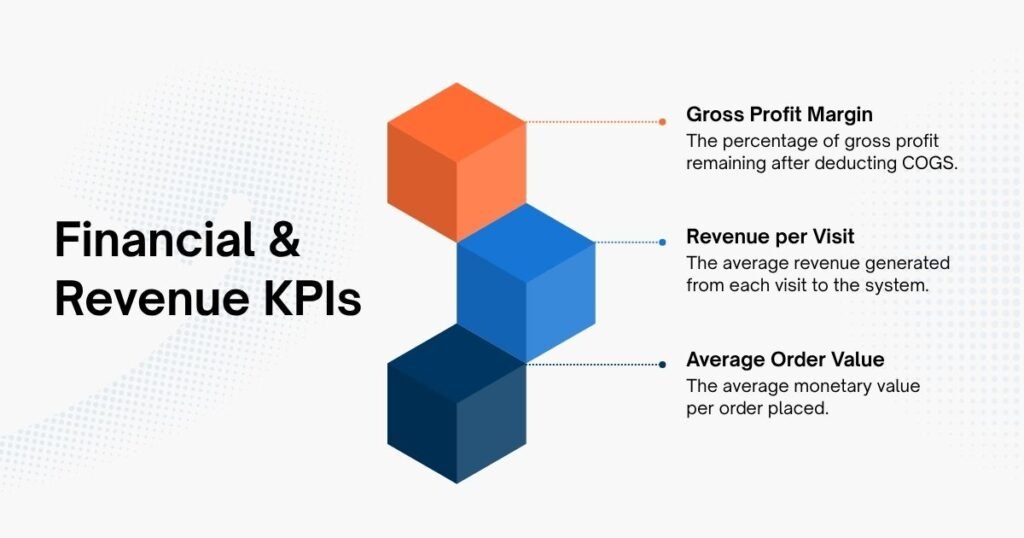
Gross Profit Margin is the percentage of revenue remaining after deducting the cost of goods sold (COGS), including production or purchasing costs, packaging, and inbound shipping costs.
Formula: (Revenue − COGS) ÷ Revenue × 100
Beauty is one of the industries with high gross margins in ecommerce. Gross margins in beauty and skincare typically range from 65–85%, making them among the highest across product categories. Public financial reports from listed brands such as e.l.f. Beauty and Olaplex also show actual gross margins of around 69–71%.
However, a high gross margin does not mean that a brand is highly profitable. A brand with a 70% gross margin may still have to use most of that margin to cover CAC, marketplace fees, and shipping costs before generating net profit. Therefore, beauty brands need to look at this metric together with CAC and the LTV:CAC Ratio to understand how much real value the margin is creating for the business.
2. Revenue per Visit
Revenue per Visit (RPV) is the average revenue generated from each visit.
Formula: Conversion Rate × AOV.
Or more simply: Total Revenue ÷ Total Visits
RPV does not have a common benchmark across the industry because the metric depends on each brand’s pricing and purchasing behavior. For example, an RPV of USD 5 may be good for a brand selling lower-priced products, but it does not mean much for a brand selling premium serums or skincare products.
Instead of looking for a standard RPV benchmark, brands should track RPV over time and across traffic sources. For example, if RPV from TikTok Shop is significantly lower than Shopee while Conversion Rate is similar, the issue may lie in AOV (such as lower-priced bundles or vouchers bringing down order value on TikTok).
3. Average Order Value (AOV)
Formula: Total Revenue ÷ Total Number of Orders
AOV in beauty varies widely depending on the subcategory. This KPI is an important input in unit economics. When combined with Gross Profit Margin, brands can estimate the absolute gross profit per order. This figure can then be compared with CAC to assess whether an order is actually generating profit.
Group 2 — Customer Acquisition
This group of KPIs focuses on a fairly direct question: how much does a brand have to spend to acquire new customers, and is that spending actually effective?
4. Customer Acquisition Cost (CAC)
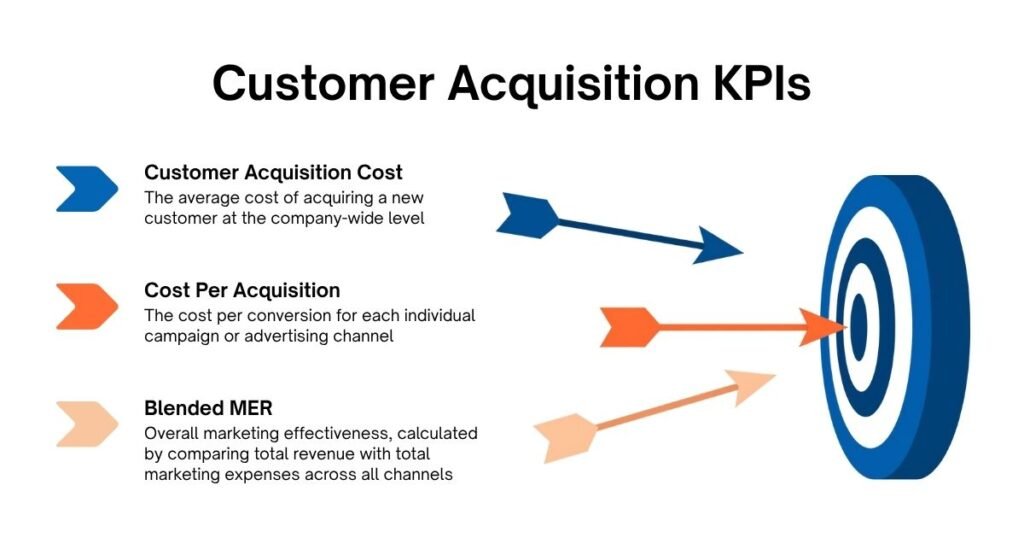
Formula: Total Marketing & Sales Costs ÷ Number of New Customers
If CAC approaches or exceeds AOV, the cost of acquiring a new customer is taking up a very large portion of the value of the first order. However, for beauty, this does not necessarily mean that the business model has a problem. A brand may need more than one purchase to recover its customer acquisition cost.
Therefore, the question should not only be “Is the first order profitable?” but also “Will the customer come back often enough and quickly enough to make up for the initial acquisition cost?” This is also why customer retention KPIs later in the article need to be viewed together with CAC.
5. Cost Per Acquisition (CPA)
CPA is often confused with CAC, but the two metrics are used at different levels.
- CPA is typically a metric reported by advertising platforms for each channel, calculated as advertising spend divided by the number of conversions recorded by the platform.
- CAC is the cost of acquiring a new customer at the business level and can include costs that individual advertising platform reports do not account for, such as organic traffic, agency fees, creative production costs, or KOL/KOC commissions.
Because each platform only sees the conversions it records, CPA for each channel does not always fully reflect the cost of acquiring a new customer. For beauty brands selling across multiple channels such as Shopee, TikTok Shop, and D2C, this gap can become even more visible when customers interact with the brand across multiple touchpoints before making a purchase.
Therefore, comparing CPA across channels is still useful when a brand needs to allocate and optimize its advertising budget. But if the goal is to understand how much the business is actually spending to acquire a new customer, the brand needs to look at CAC at the business level.
6. Blended MER (Marketing Efficiency Ratio)
Formula: Total Revenue ÷ Total Marketing Costs
(Across channels such as Shopee Ads, TikTok Ads, Meta, email, and KOL)
ROAS is often used to evaluate the performance of a campaign or individual channel. MER looks at the bigger picture by comparing total revenue with total marketing costs across all channels.
MER does not have one fixed benchmark for every beauty brand. What is considered good depends on the brand’s gross margin, size and growth stage, channel mix, and other business costs.
Measuring MER is particularly useful for beauty brands selling across multiple channels because it helps reveal a common issue: the same order can be credited to multiple platforms.
For example, Shopee Ads may report a 3x ROAS while TikTok Ads reports 4x. But when all marketing costs are combined and compared with the actual revenue recorded in the system, MER may be only 2x. In that case, marketing performance at the business level is significantly lower than what the individual platforms are reporting.
Group 3 — Customer Retention
This group of KPIs focuses on two questions: do customers come back to buy, and is the value they generate enough to cover the initial acquisition cost?
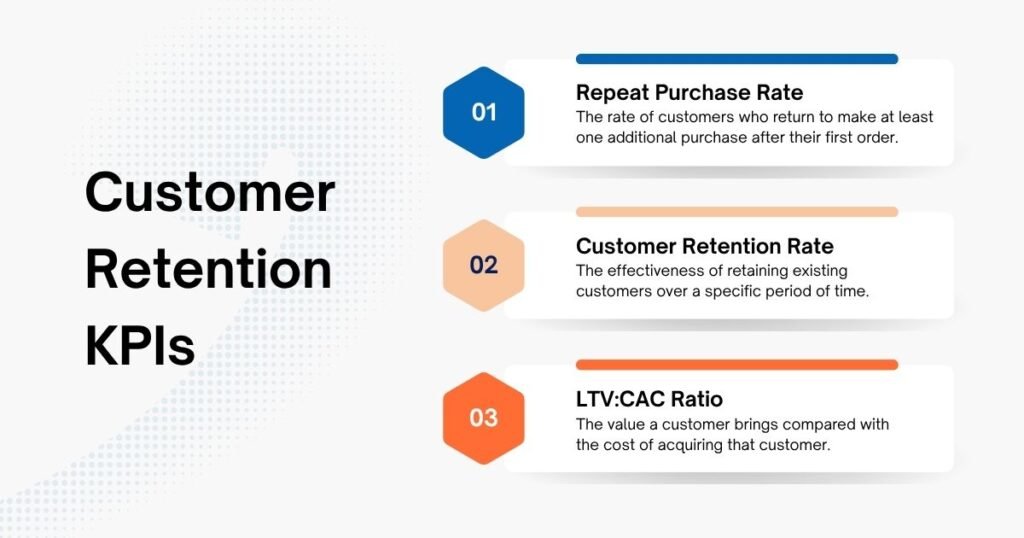
7. Repeat Purchase Rate (RPR)
Formula: Number of Customers Who Purchased ≥2 Times ÷ Total Number of Customers × 100
RPR shows how many customers have come back to make at least one additional purchase after their first order. This is an important KPI to track for beauty brands because many products in the industry have relatively clear usage and repurchase cycles.
If RPR is low, there can be many reasons: product experience, quality, price, customer retention, or simply a longer repurchase cycle. Therefore, RPR does not only tell a brand how many customers come back, but also provides a signal to investigate why customers do or do not come back.
There is no standard RPR that applies to every beauty brand. The metric depends heavily on product type, usage cycle, and business model. Categories with higher repurchase frequency, such as skincare, supplements, or coffee, tend to have higher RPR than categories with longer repurchase cycles.
8. Customer Retention Rate
Formula: (Number of Customers at End of Period − Number of New Customers During the Period) ÷ Number of Customers at Beginning of Period × 100
Customer Retention Rate is often used interchangeably with RPR, but the two metrics answer different questions.
- RPR shows how many customers have purchased at least twice.
- Retention Rate shows how many of the customers a brand had at the beginning of the period are still retained by the end of the period.
Therefore, RPR is useful for getting an overall view of the customer base’s ability to repurchase, while Retention Rate is more useful when a brand wants to track how well it retains customers over a specific period.
For beauty brands expanding quickly across multiple marketplaces, tracking Retention Rate by cohort can help brands identify recent changes more clearly, rather than only looking at the total number of loyal customers accumulated over several years.
9. LTV:CAC Ratio
LTV:CAC Ratio shows the value a customer generates compared with the cost the brand spends to acquire that customer. CAC tells a brand how much it has to pay to acquire a new customer, while LTV shows how much value that customer can generate throughout their lifetime.
Therefore, LTV and CAC are often tracked together when a brand evaluates its ability to grow and scale the business.
A 3:1 ratio is commonly used as a reference point for LTV:CAC. However, this is not a fixed threshold for every beauty brand. The appropriate ratio also depends on gross margin, CAC payback period, growth rate, and how the brand calculates LTV.
One point to keep in mind is that LTV should reflect the actual economic value generated by the customer. If revenue alone is used as LTV, a brand may overestimate the value of a customer because COGS and other related variable costs have not been taken into account.
For example:
- If CAC is USD 60 and a skincare customer’s 12-month LTV is USD 200, the LTV:CAC Ratio is approximately 3.3:1.
- If LTV is only USD 90, the ratio falls to 1.5:1.
Both cases have the same CAC, but their ability to recover acquisition costs and generate long-term value is very different.
Group 4 — Operations & Product-Specific Beauty Ecommerce KPIs
This group of KPIs helps brands identify issues that can directly affect revenue and profitability but are often difficult to see when only tracking business-level metrics.
For beauty brands, a SKU with a high return rate, slow inventory turnover, or poorly converting traffic can drag down the performance of the overall product portfolio.
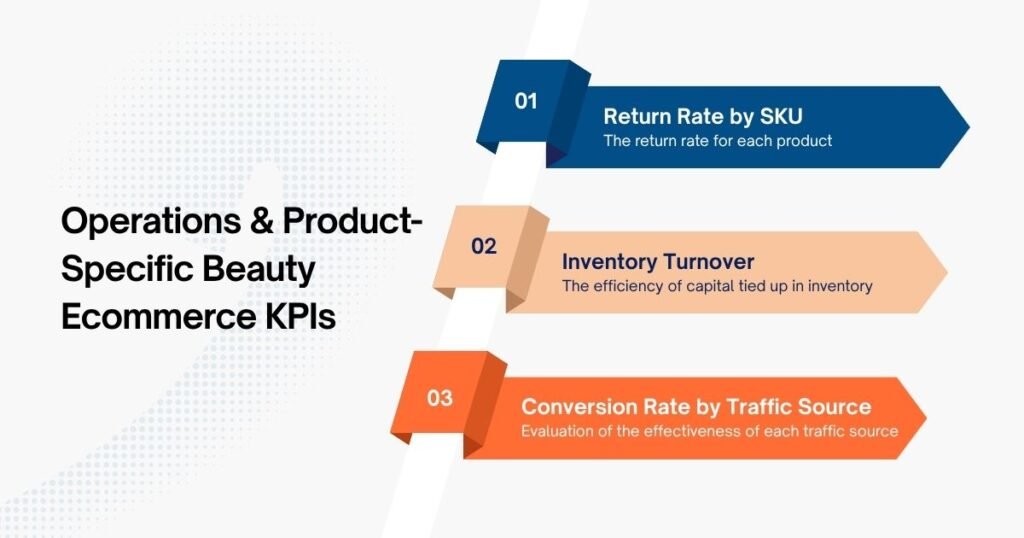
10. Return Rate by SKU
Formula: Number of Returned Orders ÷ Total Number of Orders × 100
(Calculated separately for each SKU instead of being aggregated across the entire store)
Return rates in beauty are often lower than in many other industries, partly because products that have been opened usually cannot be resold. In addition, return rates can vary significantly across subcategories. This is also why an overall Return Rate for the entire store does not tell a brand where the actual problem is.
A store selling both serum and foundation may have an average return rate of 8%, but when broken down by SKU, the brand may discover that one foundation line has a much higher return rate.
The question at this point is which SKU has a problem and where does the problem come from (such as an incorrect shade, insufficient product information, or a poor shade-selection experience).
11. Inventory Turnover
Formula: Cost of Goods Sold (COGS) ÷ Average Inventory Value
Inventory Turnover is a financial metric, different from Stock vs. Sales Velocity:
- Days of Cover: How many days of inventory remain before the product runs out?
- Inventory Turnover: How efficiently is the capital tied up in inventory being turned over?
For beauty and personal care, some market benchmarks put Inventory Turnover at around 6–10 times per year, although the appropriate level can vary depending on product type, seasonality, and business model.
A low turnover rate can indicate that a brand is stocking more inventory than demand requires or holding onto slow-moving SKUs. For beauty products with expiration dates, slow inventory turnover also increases the risk of products expiring and having to be discarded.
On the other hand, a very high turnover rate is not necessarily a good sign either. If inventory is too thin, a brand can easily run out of stock during peak sales periods, when demand rises sharply but replenishment cannot keep up.
Therefore, brands should read Inventory Turnover together with sales velocity and Days of Cover to understand whether inventory is at a healthy level or is starting to become a problem.
12. Conversion Rate by Traffic Source
Formula: Number of Orders ÷ Number of Visits from That Source × 100
Conversion Rate can vary significantly across traffic sources because users coming from different sources have different levels of brand awareness and purchase intent.
For example, for a beauty brand selling simultaneously on Shopee, TikTok Shop, and D2C, traffic from TikTok Shop livestreams may have a lower Conversion Rate than search traffic on Shopee. This does not necessarily mean TikTok Shop is less effective, because the two sources have very different user behaviors: one is more discovery-driven, while the other usually starts with a clearer search intent.
Instead of comparing sources directly against each other, brands should track the Conversion Rate of each source over time, while also looking at it alongside other KPIs such as AOV, Revenue per Visit, and CAC.
How to Use This Beauty Ecommerce KPI Set in a Real Dashboard
To make tracking easier, brands can put all four groups of beauty ecommerce KPIs into the same dashboard, such as Looker Studio, Power BI, or Shopify Analytics if they have a D2C channel. Each KPI group can be placed in its own section and updated weekly.
When reading the dashboard, it is useful to move from the overall picture to the details:
- Financial & Revenue: How much value is the business generating?
- Customer Acquisition: How much does the brand have to spend to create growth?
- Customer Retention: Are customers coming back and continuing to generate value?
- Operations & Product: If a KPI has a problem, is the cause related to a SKU, inventory, or traffic source?
This structure helps brands see the bigger picture before going deeper into individual SKUs or channels. If a brand starts with an isolated operational metric, it can easily focus on a small issue without knowing whether it actually has a meaningful impact on the business.
A Note on Combining Data from Multiple Channels
For brands selling across multiple marketplaces, the same KPI may be defined differently across platforms. For example, “new customers” on Shopee may be identified based on a Shopee account, while a D2C system may identify customers using an email address or phone number.
As a result, the same person who purchases through both channels may still be recorded as two different customers. Before combining data, brands need to standardize how each KPI is defined and calculated to avoid directly affecting dashboard accuracy.
Final Thought
The 12 beauty ecommerce KPIs above become more valuable when viewed together. Instead of simply tracking whether each KPI is going up or down, brands need to look at the relationship between the metrics to understand where growth is coming from, how much value customers are generating, and where the problem lies.
To do this at scale, data needs to be clean and consistent. This can be challenging when data comes from multiple sources, with each source using different recording methods and formats before the data is standardized into the same measurement system.
Data as a Service can help automate this data collection and processing. When internal data is combined with beauty market intelligence and competitor data, brands can not only understand how their business is performing, but also have more basis to assess where they stand in the market.
Leave a Reply