

Market data is changing the way beauty brands compete in Southeast Asia. The e-commerce market is growing rapidly, product trends are constantly evolving, and leadership positions on marketplaces can change hands within just a few months. To maintain a competitive advantage, leading brands need to identify these changes early enough and turn them into timely business decisions. Market data provides the foundation for brands to understand how the market is changing and make more informed decisions.
This article examines how leading beauty brands use market data to support decisions around product development, competitor analysis, pricing, inventory, and marketing, while also measuring the impact of those decisions on business growth.
Why Is Market Data Important for Beauty Brands in Southeast Asia?
In 2025, total platform e-commerce GMV across Southeast Asia reached USD 157.6 billion, up 22.8% year over year. TikTok Shop alone doubled its GMV to USD 45.6 billion (with Beauty & Personal Care being the largest category on the platform in the region).
This growth is taking place across multiple markets:
| Market | 2025 GMV | Growth |
|---|---|---|
| Indonesia | USD 13.1 billion | 111% |
| Thailand | USD 10–12 billion | 101% |
| Vietnam | USD 7–8 billion | 150% |
| Malaysia | >USD 5 billion | 132% |
| Philippines | USD 4–5 billion | 99% |
As the market expands rapidly, the competitive landscape is changing just as quickly. A growing product category can become crowded within just a few months, while a brand that is leading the market can be overtaken by competitors in the following quarter.
Therefore, data from the previous period is not always enough to explain the opportunities in the next one. Indonesia provides a clear example of how quickly the market can change.
Beauty market share data on Shopee Indonesia shows:
| Period | Leading Brand | Market Share |
|---|---|---|
| Q1/2025 | Skintific | 7% |
| Q2/2025 | MS Glow | 7.26% |
| Q4/2025 | Skintific | 5.99% |
In Q2/2025, MS Glow (an Indonesian local brand) overtook Skintific, pushing Skintific into second place. By Q4, Skintific had returned to the leading position, while MS Glow had fallen to fourth place.
If beauty brands only look back at quarterly business performance reports, changes like these may only become clear after they have already affected performance. Regularly tracking market data helps brands identify changes in demand and the competitive landscape earlier, giving them more time to adjust.
What Business Decisions Can Market Data Support?
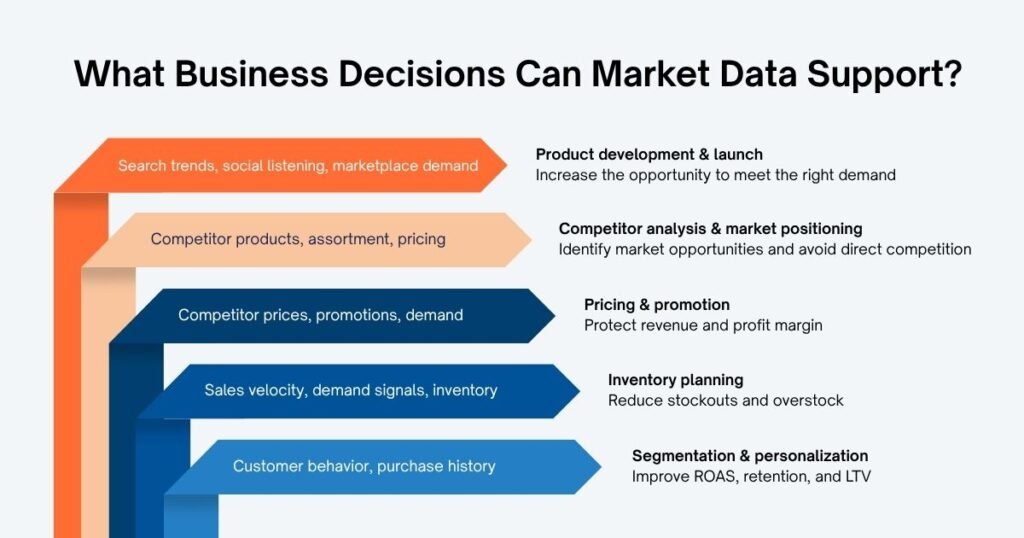
Market data only creates value when it is connected to a business question, a specific decision, and a measurable outcome.
Market Data for Product Development and Product Launch
Analyzing market data helps brands identify beauty product demand and trends earlier, giving them a stronger basis for deciding which products to develop, when to launch them, and on which marketplace.
In beauty e-commerce, signals such as ingredients, product formats, packaging, and bundles can change quickly, particularly on TikTok Shop. Some signals worth monitoring include:
- Search demand rising rapidly for an ingredient or product category.
- Sales increasing significantly within a price segment.
- A product format or packaging appearing frequently in short-form videos.
- Reviews and social content showing that consumers are becoming more interested in a specific need.
- A product category beginning to grow on a marketplace while competitor assortment remains limited.
A single signal is not enough to identify a product opportunity. But when search demand, marketplace sales, reviews, and social conversations all indicate increasing interest, brands have a stronger basis for evaluating trend momentum before investing in product development.
Competitor Analysis and Market Opportunity Identification
Competitor data does more than show what competitors are selling. It helps brands identify where competitors are focusing and where gaps remain in the market.
Some of the gaps that can be identified through data analysis include:
- A price segment with demand but few mid-range brands.
- A customer group that is not clearly served by major brands.
- A product category with demand but limited assortment.
- Competitors frequently experiencing stockouts in a product line.
- A segment with many brands but no clear positioning.
These opportunities are difficult to identify by tracking only a few direct competitors or manually checking prices at a single point in time. Given the high level of competition in Beauty & Personal Care across marketplaces, a market opportunity does not necessarily lie in a segment with many players. It may instead lie in a segment, price point, customer need, or product category that competitors are not serving well.
Pricing Strategy and Profit Margin Optimization
Price data helps brands make pricing decisions based on demand, competitor pricing, and promotion activity, rather than reacting every time a competitor cuts prices.
Some price signals can indicate:
| Price signal | Business implication |
|---|---|
| Competitor significantly reduces prices | Determine whether this is a short-term promotion or a long-term price change |
| Prices decrease but sales do not increase significantly | Assess the price sensitivity of demand |
| Product continues to sell well at the current price | A deeper promotion may not be necessary |
| Multiple competitors reduce prices at the same time | Identify a campaign or potential price war |
| Competitor runs out of stock after reducing prices | Distinguish increasing demand from stock clearance |
Monitoring beauty product price movements continuously helps brands determine when to adjust prices, when to run promotions, and when to maintain current prices. The goal is not to compete by setting prices lower than competitors, but to maintain a price level that fits demand, competitive position, and profit margin.
Inventory Management and Demand Forecasting
Leading beauty brands analyze market data to adjust inventory according to changing demand, rather than relying solely on historical sales.
When search demand, marketplace sales, and product momentum are all increasing but inventory is still planned based on historical data, brands may replenish too late and face stockouts. Conversely, when demand declines but order volumes remain unchanged, overstock and discounting can become a problem.
To track demand and inventory more effectively, brands typically combine:
- Sales velocity
- Demand trends
- Marketplace performance
- Competitor availability
- Product seasonality
- Inventory levels
These signals support decisions such as:
- Which SKUs need earlier replenishment.
- Which SKUs are at risk of stockouts.
- Which SKUs show signs of overstock.
- When to reduce order volumes.
- When to adjust promotions to improve sell-through.
The goal is to move from reacting to historical sales to identifying changes in demand earlier, thereby improving inventory efficiency, sell-through, and profit margin.
Customer Segmentation and Personalized Marketing
Customer data helps brands distinguish between customer groups with different needs, purchasing behaviors, and levels of price sensitivity. By combining customer behavior with sales and marketplace data, brands can segment customers based on:
- Product interest
- Purchase frequency
- Average order value
- Price sensitivity
- Repurchase behavior
- Category preference
Marketing teams can use these segments to adjust content, offers, and budgets instead of applying the same campaign to the entire customer base.
For example, groups with high purchase frequency may be suitable for retention campaigns, while first-time buyers may need educational content or product recommendations to increase the likelihood of repurchase.
When used properly, customer data helps brands allocate marketing resources more effectively and improve business metrics such as ROAS, CAC, repeat purchase rate, and LTV.
How to Turn Market Data Into Business Decisions
Leading beauty brands do not view market data as an independent research activity or simply as a reporting dashboard. They incorporate market data into their ongoing decision-making process.
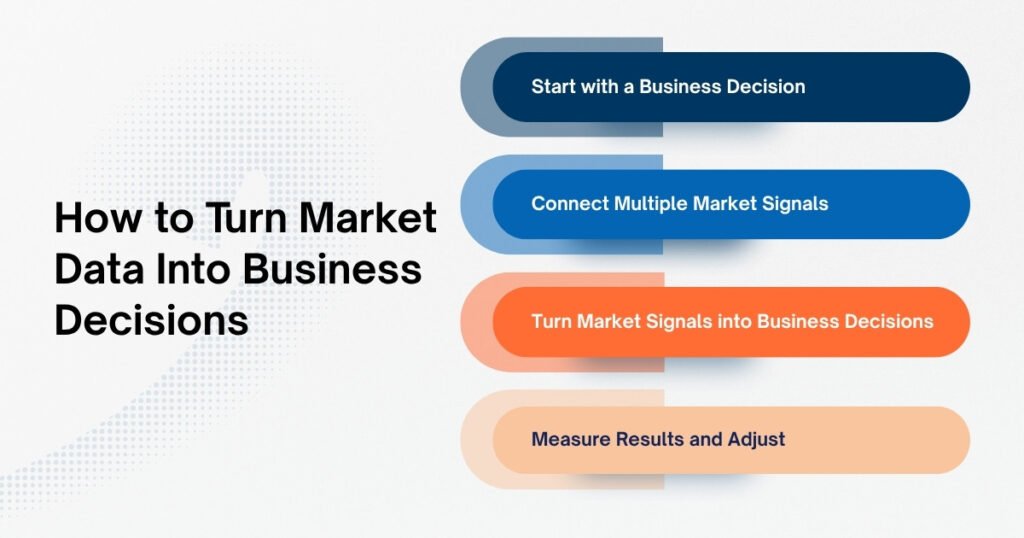
1. Start with a Business Decision
Leading beauty brands typically start with a business question to determine which market signals need to be collected and analyzed.
For example:
- Should the brand launch a new beauty product?
- Should inventory be increased for a specific SKU?
- Should the price be adjusted?
- Should investment in a specific channel be increased?
- Should the brand enter a new price segment?
2. Connect Multiple Market Signals
A single signal only provides part of the picture. For example, an increase in search demand for an ingredient does not necessarily mean that it is a sufficiently large product opportunity. Brands need to consider marketplace sales, social conversations, reviews, and competitor assortment to determine whether that interest is translating into actual demand.
In this way, each data source is used to examine a specific part of the issue, helping the brand answer the original business question and determine the next step.
3. Turn Market Signals into Business Decisions
Once a market insight has been identified, the next step is to determine specific actions across different areas of the business. For example:
| Market insight | Business decision |
|---|---|
| Demand for a product category is growing rapidly | Prioritize testing or product development |
| Competitor product assortment remains limited in a specific segment | Evaluate the opportunity to enter or expand in that segment |
| Competitors reduce prices but demand does not increase proportionally | Do not automatically follow competitors with a price reduction |
| Demand is increasing while inventory remains low | Prioritize replenishment |
| A customer segment has higher LTV | Increase investment in retention and personalization |
4. Measure Results and Adjust
After implementing a decision, leading beauty brands track its actual impact on business performance rather than assuming that the decision has been successful.
The result of one decision becomes an input for the next decision-making cycle. For example, product performance may influence future assortment planning, while customer responses may guide pricing, promotion, or customer retention strategies.
How to Measure the Business Impact of Market Data
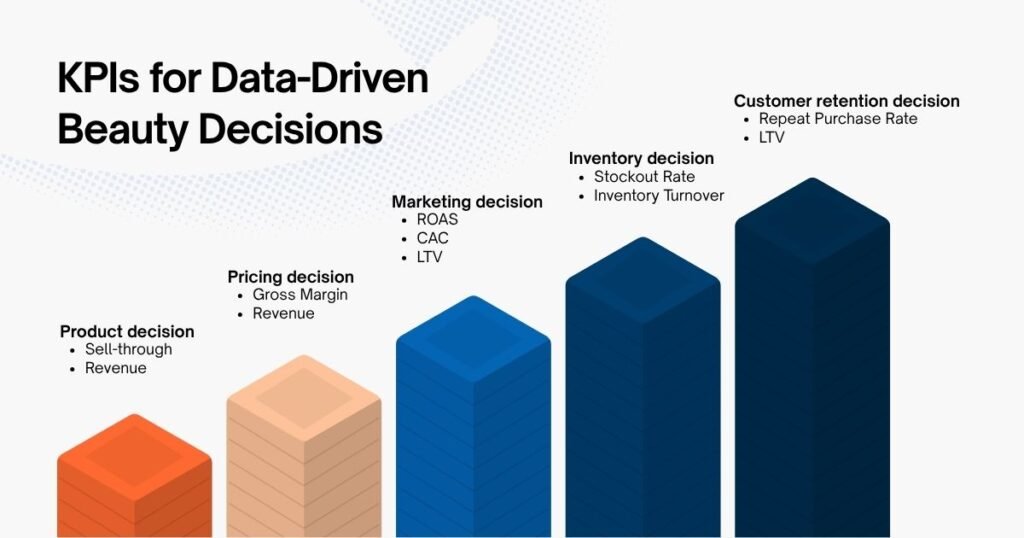
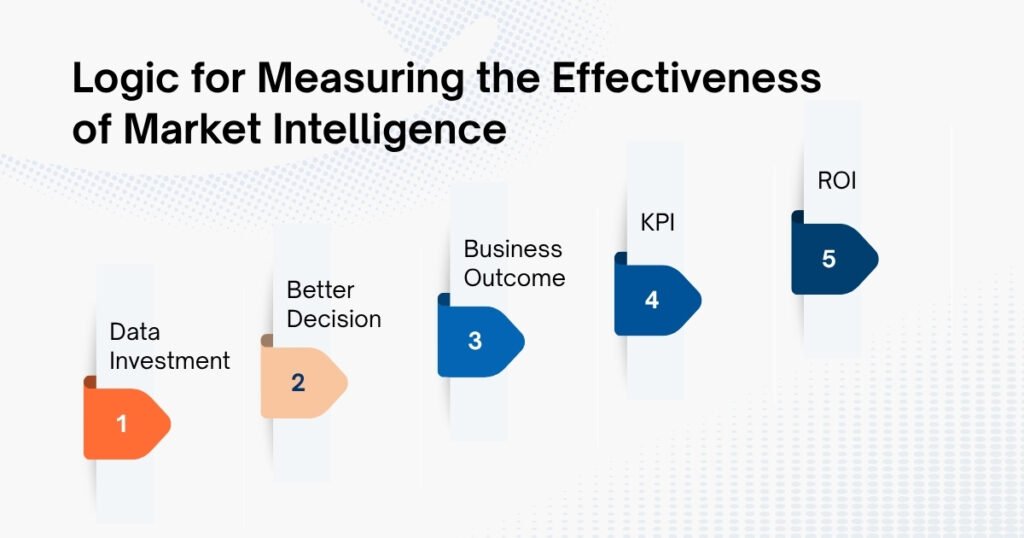
Leading brands do not measure beauty market intelligence by the number of data points or dashboards created. Instead, they connect each group of data to a business decision, business outcome, and specific KPI.
| Business area | Data-driven decision | Business outcome | KPI |
|---|---|---|---|
| Product development | Launch / discontinue / expand SKU | Increase revenue and sell-through | Revenue, Sell-through Rate |
| Pricing | Adjust price / promotion | Protect profit margin | Gross Margin, Revenue |
| Marketing | Reallocate budget / personalize campaigns | Improve acquisition efficiency | ROAS, CAC, LTV |
| Inventory | Replenish / reduce stock | Reduce stockouts and overstock | Stockout Rate, Inventory Turnover |
| Customer retention | Target high-value segments | Increase repeat purchase | Repeat Purchase Rate, LTV |
A team can collect millions of data points every month and still create very little value if the data does not lead to any change in business decisions. Conversely, a small market signal that helps a brand avoid overstock, protect margin, or identify a product opportunity early can still create a significant impact.
Therefore, the effectiveness of market intelligence should be evaluated through the following chain:
Building a Repeatable Market Data Workflow
A good decision can create positive results in the short term. However, to maintain an advantage, leading brands turn market data tracking and analysis into part of their operational activities.
| Weekly | Track demand, market trends, and competitor movement. Update pricing and promotions in the market. Record unusual changes that require further analysis. |
| Monthly | Evaluate the results of decisions that have been implemented. Compare performance across SKUs, segments, and markets. Adjust product, pricing, marketing, or inventory strategy when needed. |
| By Product Launch Cycle | Check market demand before launch. Monitor trend momentum and competitor activity. Evaluate performance after launch. Update product strategy based on new data. |
When incorporated into regular operations, market data is applied effectively: a report used when research is needed becomes a foundation for brands to monitor the market, evaluate results, and adjust decisions in a timely manner.
Market Data Analytics for E-commerce in Southeast Asia
When working across multiple markets and marketplaces at the same time, the challenge is not only having enough data but also how that data is organized and standardized.
The same product category can have different price levels, assortment, seller landscapes, and growth rates between Shopee Indonesia and TikTok Shop Vietnam. If data is not collected and standardized using the same structure, comparisons across markets or platforms can lead to inaccurate conclusions.
This is why data collection needs to be built alongside data analytics from the beginning. Data needs to be collected frequently enough to track movement, in enough detail to drill down to the SKU or category level, and consistently enough to allow comparisons across markets and platforms.
Easy Data supports both areas through data scraping services and a data analytics platform for e-commerce in Southeast Asia. Data scraping helps collect data from Shopee, Lazada, and TikTok Shop according to specific structures and analytical requirements. The data analytics platform then helps organize, standardize, and analyze the data so brands can work with the same data framework when monitoring multiple markets and marketplaces.
This approach focuses on turning data from multiple markets and platforms into a comparable, analyzable, and long-term data system, rather than treating each data source as a separate report.
Conclusion
Market data does not create business growth on its own. Its role is to help brands detect changes earlier, make more informed decisions, and adapt faster as the market evolves. For beauty brands in Southeast Asia, these decisions can directly involve product development, market positioning, pricing, inventory, or marketing.
When market data is monitored continuously, analyzed in the right context, and connected to business outcomes, brands can build a more consistent decision-making process rather than simply reacting after performance has already changed.
Leave a Reply