

Having data does not automatically create a competitive advantage. What truly sets businesses apart is their ability to turn data into informed decisions and effective business actions. When data is scattered across multiple systems, it becomes difficult to identify market trends, uncover growth opportunities, and make timely decisions.
An analytics platform is designed to solve this challenge by connecting, processing, analyzing, and visualizing data within a unified environment. As a result, businesses can monitor performance in near real time, detect emerging trends, and make decisions based on data rather than intuition.
What is an Analytics Platform?
An analytics platform is a centralized system that collects, processes, analyzes, and visualizes data from multiple sources, helping businesses turn raw data into actionable insights and make data-driven decisions.
Unlike tools that focus on only one stage of the data workflow (such as data collection or report visualization), an analytics platform manages the entire data lifecycle within a single unified system. This enables businesses to shorten data processing time, maintain consistency across different systems, and make faster, more informed decisions.
How a Modern Analytics Platform Operates
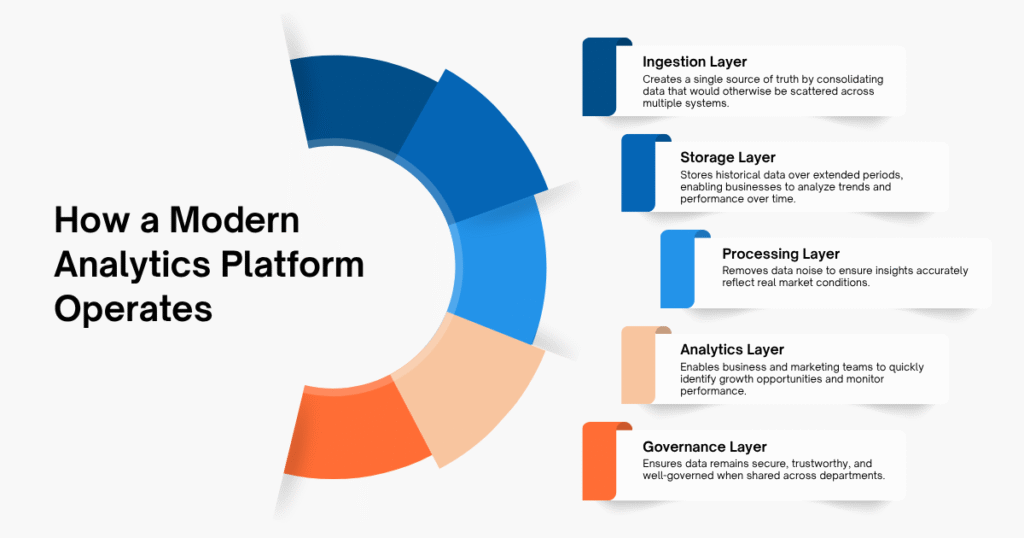
To transform data from multiple sources into valuable business insights, a modern analytics platform typically operates through five functional layers. Each layer serves a distinct purpose (from data collection and processing to analytics, visualization, and governance) forming a complete end-to-end data workflow.
Layer 1: Ingestion Layer (Data Collection)
This is the first layer of the platform, responsible for collecting data from multiple sources and consolidating it into a unified environment.
For ecommerce businesses, data may come from marketplace APIs such as Shopee, Lazada, and TikTok Shop, automated data-scraping systems, or internal platforms such as CRM, ERP, and Shopify. Centralizing data at the ingestion stage eliminates information silos across different systems and establishes a single source of truth for the entire organization.
Layer 2: Storage Layer (Data Storage)
Once collected, data is stored in an infrastructure designed to handle large volumes of information while scaling with business needs. Some modern analytics platforms are built on a Data Lakehouse architecture, enabling them to store data from multiple sources while maintaining fast query performance for analytics. This allows businesses to retain and analyze historical data over many years without compromising processing efficiency.
Layer 3: Processing and Transformation Layer (Data Processing)
This is the core processing layer of an analytics platform, where raw data is cleaned, standardized, and enriched with additional context before it is ready for analysis.
In ecommerce, data is often influenced by promotional activities such as Flash Sales, vouchers, seller discounts, and shipping subsidies. If these promotions are recorded without adjustment, they can distort actual selling prices and lead to inaccurate analysis. To address this, an analytics platform removes promotional noise to identify the underlying base pricing structure, providing a more accurate representation of market pricing and actual revenue.
Beyond data cleansing, the platform also performs data enrichment by combining internal business data with external market intelligence, including competitor pricing, brand market share, consumer trends, marketplace sales performance, product catalog information, and price segment data. Enriching data with these additional dimensions gives businesses a more comprehensive view of the market, competitors, and overall business performance before making strategic decisions.
Layer 4: Analytics Layer (Analytics and Visualization)
After processing, data is transformed into reports and interactive dashboards that businesses can immediately use. Instead of working with complex spreadsheets or raw datasets, users can monitor key ecommerce analytics metrics through intuitive dashboards and analyze performance by brand, product category, SKU, or price segment with just a few clicks.
Beyond data visualization, many analytics platforms also incorporate machine learning models to forecast market demand, consumer behavior, and growth trends. These predictive insights help businesses plan more proactively, optimize product portfolios, and make better data-driven decisions.
Layer 5: Governance Layer (Data Governance and Security)
The final layer ensures that data is properly managed and protected throughout its entire lifecycle. Enterprise-grade analytics platforms typically include capabilities such as Access Control for user permissions, Data Lineage for tracking data origins and transformations, and robust security standards to ensure data remains accurate, consistent, and fully auditable.
As a result, businesses can securely share data across departments and systems while maintaining transparency, governance, and trust throughout the decision-making process.
How Analytics Platforms Solve Real Business Challenges
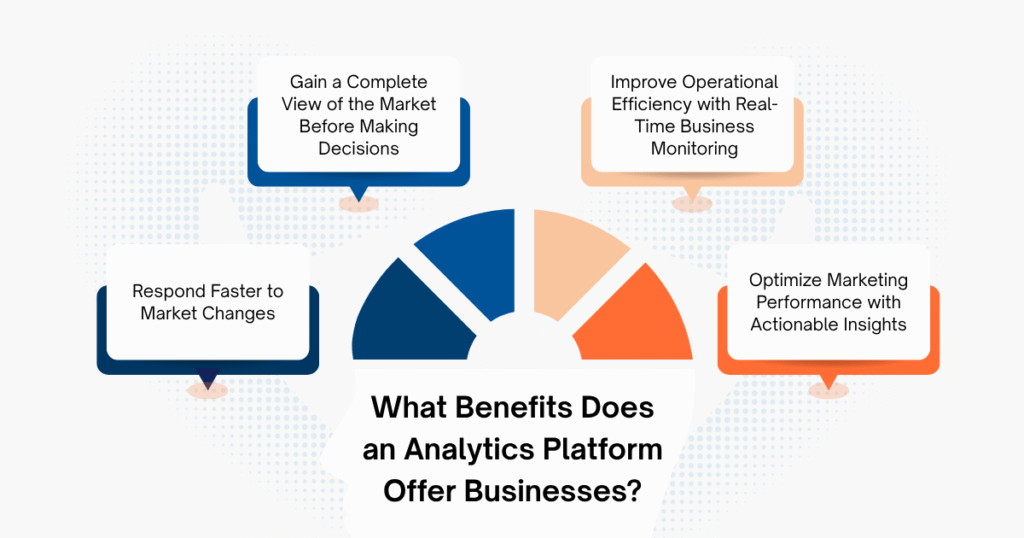
An analytics platform helps businesses solve a wide range of decision-making challenges, from responding to market changes and improving operational efficiency to optimizing marketing performance. Below are some of the most common use cases in ecommerce.
Respond Faster to Market Changes
The ecommerce market changes constantly. Competitors can adjust prices, launch promotions, or introduce new products within hours. If businesses detect these changes too late, valuable growth opportunities may already have been captured by competitors.
By automatically collecting data from multiple sources and updating dashboards in near real time, an analytics platform enables business teams to monitor market changes as they happen. Instead of spending days or even weeks consolidating and processing data manually, businesses can respond much more quickly to shifting market conditions.
For example, data from the Easy Data SEA Diaper Dashboard shows that in October 2025, the diaper category on Shopee across Southeast Asia generated USD 53.8 million in revenue, with 6.7 million units sold across 1,129 brands.
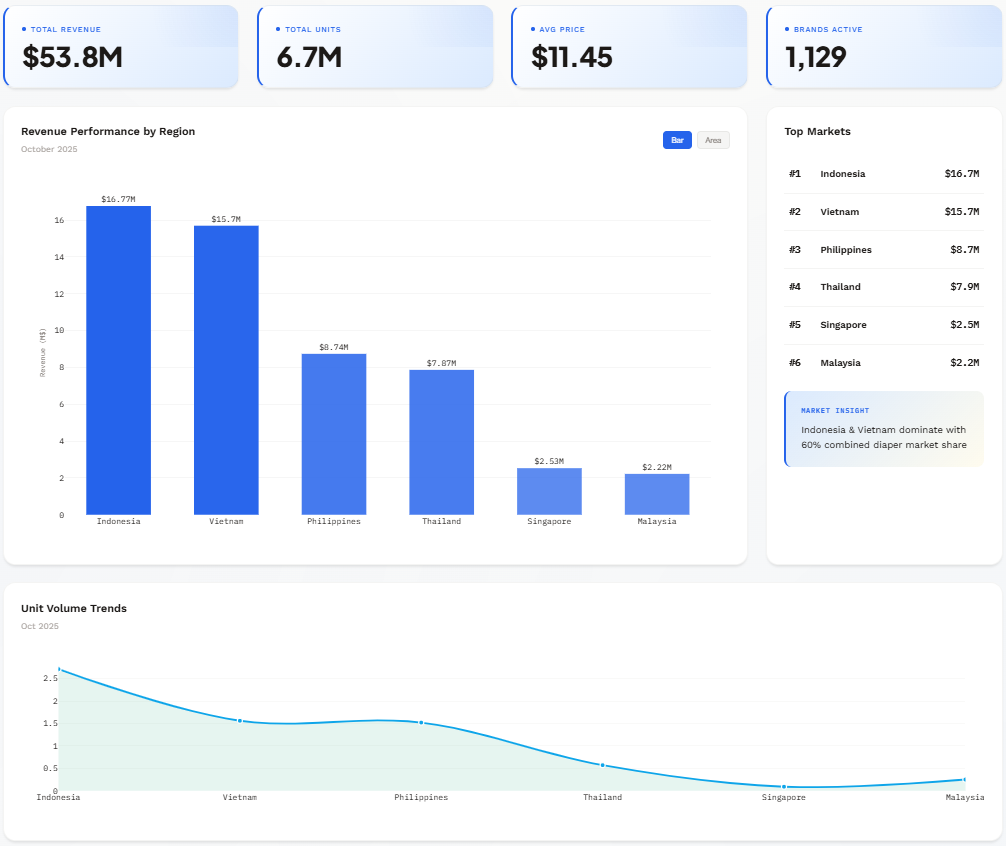
The dashboard also reveals significant differences in average selling price (ASP) across markets. While the ASP in Singapore reached USD 28.11, the Philippines recorded an ASP of only USD 5.75.
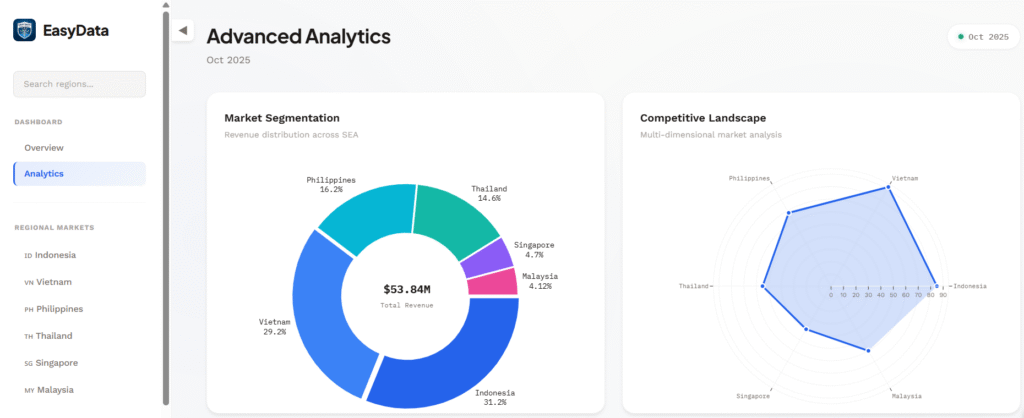
These insights help businesses adjust their pricing strategies and product portfolios for each market. Without timely visibility, companies may set prices that do not match local demand and miss valuable competitive opportunities.
Gain a Complete View of the Market Before Making Decisions
Many businesses still evaluate performance primarily through internal metrics such as revenue, GMV, or order volume. However, these metrics only reflect their own business performance; they do not reveal how the overall market is changing or where the brand stands relative to its competitors.
Ecommerce data reports within an analytics platform provide a comprehensive market view by combining internal business data with industry-wide intelligence. Businesses can monitor market size, brand market share, consumer trends, price segmentation, and competitive dynamics across ecommerce marketplaces.
As a result, decisions related to product development, brand positioning, and market expansion are based on market intelligence rather than assumptions.
Improve Operational Efficiency with Real-Time Business Monitoring
When sales, inventory, and financial data are stored across multiple systems, monitoring business performance often becomes time-consuming and prone to errors. Instead of switching between different data sources and manually consolidating reports, businesses can monitor their entire operation through a unified analytics platform dashboard. This ensures that key operational metrics (including revenue, inventory, and business performance) are updated in near real time.
Users can quickly identify issues such as low inventory, declining sales, or changes in market pricing, allowing them to replenish stock, adjust pricing strategies, or launch promotional campaigns at the right time. This not only streamlines operations but also helps protect profit margins and reduce costs associated with delayed decision-making.
Optimize Marketing Performance with Actionable Insights
For marketing and affiliate teams, measuring campaign performance goes beyond tracking impressions and clicks. More importantly, they need to understand which campaigns are generating revenue and delivering the highest return.
By visualizing data from multiple campaigns within a single analytics platform, marketing teams can monitor conversion rates, revenue, and the performance of individual KOLs and KOCs in near real time.
With these insights, teams can quickly adjust budgets, optimize campaign content, or reallocate resources while campaigns are still running, instead of analyzing results only after all marketing costs have already been incurred.
What to Consider When Choosing an Analytics Platform
Not every analytics platform is the right fit for every business. Choosing the right platform should start with your actual business needs, the scale of your data, and how well the platform integrates with your existing technology stack.
1. Start with Your Business Needs
Before comparing different platforms, businesses should first identify the problems they are trying to solve.
- Small businesses that only need to track basic metrics such as website traffic, conversion rates, or revenue can often start with general-purpose analytics tools.
- Businesses operating across multiple sales channels and requiring data integration from ecommerce marketplaces, CRM, and ERP systems will need an analytics platform capable of consolidating data and visualizing it through a unified dashboard.
- Large enterprises typically require additional capabilities such as unsampled data, role-based access control across multiple departments, and direct integration with internal business intelligence (BI) systems.
2. Evaluate the Platform Beyond Features
When evaluating an analytics platform, don’t focus solely on the number of features it offers. More importantly, consider whether the platform fits your organization’s workflows and operational requirements.
Some key questions to ask include:
- Is the dashboard intuitive enough for business and marketing teams to explore insights independently, or will they still rely heavily on data analysts?
- Does the platform support critical use cases such as competitor monitoring, SKU-level profitability analysis, or marketing campaign optimization?
- Can it integrate with CRM, ERP, or BI platforms such as Power BI through APIs?
- Does it provide user access control, data lineage, and enterprise-grade security features?
- Is the pricing model transparent and easy to scale as your data requirements grow?
- Will your business retain full ownership of its data, or become dependent on the vendor?
How Easy Data Platform Powers Data-Driven Decisions
Easy Data brings all of these capabilities together through an analytics platform purpose-built for ecommerce businesses across Southeast Asia. Depending on their business needs, organizations can access and utilize data in three different ways:
- Ecommerce Data Reports provide ready-to-use market intelligence, covering key metrics such as market size, CAGR, brand market share, price segmentation, and consumer trends. These reports enable businesses to quickly assess category potential without having to collect and process data themselves.
- Interactive Analytics Dashboards allow users to monitor revenue, sales performance, price movements, and market trends through intuitive dashboards such as the Shopee Seller Dashboard and Shopee Affiliate Dashboard.
- Ecommerce Data API enables businesses to synchronize ecommerce data directly with Power BI, Tableau, ERP systems, or other internal platforms. This allows organizations to leverage ecommerce data within their existing technology stack while maintaining a single source of truth.
What differentiates all three delivery formats is that they are powered by the same data processing engine. Before data is delivered through reports, dashboards, or APIs, it is cleaned, standardized, and stripped of promotional noise such as Flash Sales, vouchers, and shipping subsidies to accurately reveal the underlying base pricing structure and true market demand. As a result, businesses can build pricing strategies, evaluate competitors, and make decisions based on more reliable and trustworthy data.
Conclusion
In ecommerce, data only creates value when it is translated into timely decisions. An analytics platform enables businesses to connect, process, and visualize data within a unified environment, helping them respond more quickly to market changes and optimize business performance.
As competitive advantage increasingly depends on the speed and quality of decision-making, investing in an analytics platform is not just an investment in data; it is an investment in long-term growth capabilities.
Leave a Reply