

Shopee data analysis helps teams compare products, sellers, prices and promotions over time. Start by separating your own shop reports from public listing observations and third-party estimates: each supports different conclusions. This guide covers data types, tool checks and analytical techniques, including a fictional worked example. Reviewed October 1, 2026. For metric definitions across sources, see our ecommerce market analysis guide.
What Is Shopee Data Analysis?
Shopee data analysis is often misunderstood as simple marketplace monitoring, but in practice it involves interpreting how products, sellers, and promotions interact over time.
Defining Shopee Data Analytics
Shopee data analytics refers to the process of transforming raw marketplace data into structured insights that support business decisions.
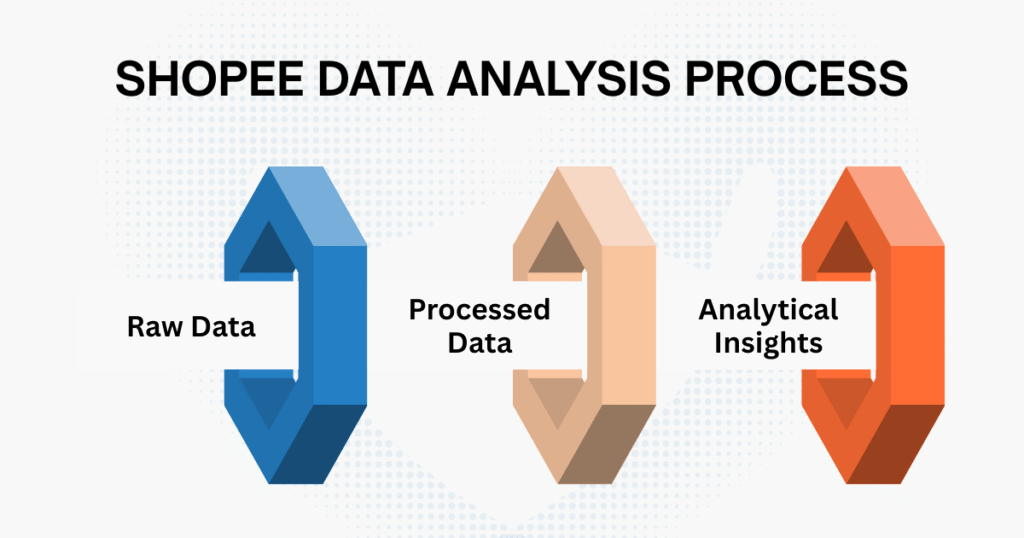
For your own shop, use reports available in your authorized Seller Centre account. Shopee’s Malaysia seller training on Business Insights illustrates shop and product reporting; it is an archival regional guide, so confirm current fields and definitions in your account. Public listing data does not reveal competitors’ complete orders, margins or customer journeys. Keep these layers separate:
- Raw data: source records such as authorized shop exports or public listing observations, retained with market, currency, collection time and source identifiers.
- Processed data: cleaned records with documented variant matching, category mapping, missing values and duplicate handling.
- Analytical insights: conclusions accompanied by sample coverage, metric definitions, assumptions and uncertainty.
Effective Shopee data analytics is not about collecting data alone, but about systematically interpreting how the marketplace behaves over time.
How Shopee Data Differs from Other Marketplaces
Cross-marketplace comparisons need equivalent products, countries, time periods and price definitions. A general claim that Shopee is always more fragmented or volatile requires a defined comparative dataset; this guide does not establish that ranking.
- Shopee vs Amazon: map product and variant identifiers carefully. A seller listing is not necessarily a unique product, and different catalog structures can change listing counts.
- Shopee vs Lazada / TikTok Shop: record campaign dates, shipping, voucher eligibility and bundle quantities separately. Compare the same price concept rather than mixing displayed item prices with checkout totals.
Use repeated observations when the question concerns change over time. A snapshot remains useful for a clearly bounded assortment or price comparison; it cannot establish a trend by itself. For a concrete source example, the May 2025 Shopee Thailand diaper dataset describes its recorded fields, coverage and interpretation limits. Its single dated export cannot establish monthly sales or a price trend.
Shopee Data Analysis vs Manual Marketplace Research
Manual marketplace research (such as browsing listings or checking competitors individually) can be useful for quick validation. However, it does not scale well when teams need:
- Coverage across thousands of SKUs
- Multi-category or multi-country visibility
- Historical comparisons over weeks or months
Keep manual spot checks as a quality-control step. Repeatable analysis requires the same inclusion rules, collection schedule and data definitions in every batch; automation alone does not make the result reliable.
Types of Shopee Data You Can Analyze
Combine data dimensions only when their scope and identifiers align. The table distinguishes what each source can describe from conclusions it cannot establish on its own.
| Data type | Fields, use and limits |
|---|---|
| Product and assortment | Fields: item/variant identifiers, category path and attributes. Use: describe observed assortment and attribute completeness. Limit: duplicate listings and missing pages distort coverage; listing count is not unique-product count. |
| Pricing and promotion | Fields: displayed price, variant, currency, timestamp, shipping and promotion conditions. Use: compare equivalent offers and repeated prices. Limit: a visible discount is not necessarily the price every buyer pays. |
| Seller and brand | Fields: seller identifier, stated brand and observed listing distribution. Use: compare sampled seller presence and assortment overlap. Limit: listing share is not sales or revenue share; verify brand attribution. |
| Search and visibility | Fields: query, sampled rank, collection context and authorized report metrics where available. Use: monitor a defined visibility measure. Limit: sampled position does not establish total search volume, customer intent or future demand. |
Popular Tools for Analyzing Shopee Data
Tools help speed up access to Shopee data and surface patterns, but they only become useful when paired with clear analytical questions. In practice, many teams rely on dedicated Shopee analytics tools to monitor pricing behavior, seller competition, and visibility trends at scale.
Choose tools by the question and the available data, then verify country coverage, authorization, refresh intervals, export fields and metric definitions. The categories below are evaluation examples, not a hands-on accuracy ranking.
- Price and Competitive Intelligence Tools
Price2Spy describes price monitoring and product matching. Before treating it as a Shopee solution, confirm the relevant country domain, supported fields, variant matching and refresh frequency with the provider. Check a sample against the source at the same time and buyer context.
- All-in-One Seller Analytics Platforms
SellerApp’s seller-analytics documentation describes Amazon-focused features. Do not assume those features or datasets apply unchanged to Shopee; request current Shopee-specific documentation and a demonstration for your market. For authorized shop operations, confirm exactly which reports a connector imports and which figures it estimates.
- Advertising and Campaign Analytics Tools
Start with your authorized Shopee Ads campaign reports. Malaysia’s current documentation distinguishes placed and confirmed metrics, direct and shop-wide attribution, and clicks from views. Preserve the report’s attribution window and metric definition; an attributed conversion is not automatically a completed, non-returned order or incremental profit. Definitions and available ad products may differ by market.
- Trend, Operations, and Engagement Analytics
Other analytical needs require their own source checks:
- Trend research: identify the underlying search engine, marketplace or social source. A web-search trend or a sampled result position is not Shopee-wide query volume or sales demand.
- Operations: PowerSell’s FAQ describes multi-channel selling functions. Treat this older documentation as a starting point, and verify present Shopee integration, supported markets and export availability before choosing a plan.
- Live-stream analysis: use authorized platform reports for sessions, engagement and attributed outcomes. Record the attribution rules and distinguish content-assisted orders from viewers who merely watched.
- Customer support analysis: use authorized support records with appropriate access controls. Message counts, response times and topic summaries measure support activity; they do not represent total marketplace demand.
Putting Tools in Perspective
Each tool contributes partial insight into Shopee’s ecosystem, but none replaces structured analysis based on raw data and sound methodology. Effective Shopee data analytics depends on knowing when dashboards are sufficient and when deeper data exploration is required.
For further tool-evaluation questions, see AI Tools for Shopee Analytics to Boost E-commerce Success. Verify each provider’s current documentation and data access before relying on a capability claim.
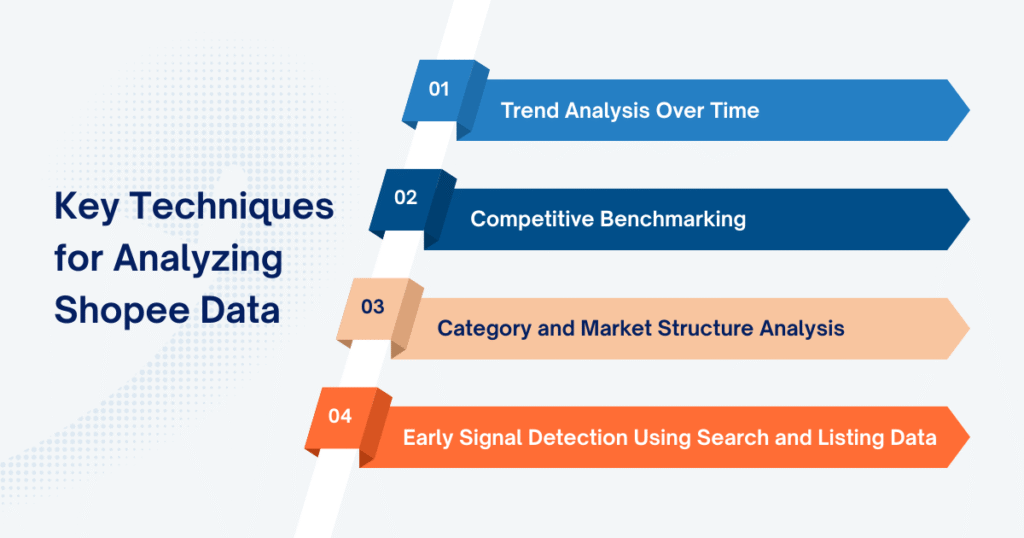
Key Techniques for Analyzing Shopee Data
Shopee data analytics delivers value not through isolated metrics, but through how signals are interpreted across time, competitors, and market structure. The techniques below focus on reading marketplace behavior, rather than executing predefined workflows, helping analysts move from raw data to meaningful insight.
- Trend Analysis Over Time
Trend analysis asks whether a change persists beyond a particular observation window. Analyzing data over time requires consistent timestamps and intervals. Annotate campaigns, missing collection periods and changes in the sample before interpreting a movement.
Instead of observing prices or listings at a single moment, effective Shopee data analytics tracks how variables evolve across multiple periods. For example, a sudden price drop may appear alarming in isolation, but when viewed across several weeks, it may align with recurring campaign cycles rather than a true competitive shift.
Trend analysis is especially useful for:
- Comparing campaign and non-campaign periods with comparable coverage, while treating the difference as an association unless the design supports causality.
- Measuring observed assortment expansion or contraction after separating genuinely new listings from collection failures or category remapping.
- Checking how sales, traffic, stock availability and promotional exposure move together in your authorized shop reports.
Report the matched sample and the missing observations alongside the result. This prevents a change in coverage from masquerading as a change in prices or assortment.
Worked example: a matched price cohort. This is fictional arithmetic, not a Shopee dataset or client result. You observe 100 item-and-variant pairs in week one and can match 80 in week two. Report matched coverage as 80 ÷ 100 = 80%; keep the 20 unmatched records in a separate missing-data count rather than treating them as zero-priced or discontinued products.
For those same 80 pairs, suppose the median displayed item price changes from 120,000 VND to 114,000 VND. The change is (114,000 − 120,000) ÷ 120,000 × 100 = −5%. Use the same currency, variant definitions and observation schedule in both weeks; this example excludes shipping and buyer-specific vouchers. It describes the matched sample, not the entire category or a causal effect of promotions.
Make the analysis reproducible: save the source batch identifiers, inclusion rules, matching decisions, missing-record log and calculation version. Keep the unmodified inputs so another analyst can reproduce the result. For checks on failed pages and unreliable inputs, see our web scraping problems and fixes.
- Competitive Benchmarking
Competitive benchmarking within Shopee data analytics is less about ranking winners and losers, and more about understanding relative positioning.
Rather than comparing a single seller against the entire market, meaningful benchmarking normalizes comparisons within the same category, price band, and promotion context. This helps answer questions such as:
- Which sellers maintain price stability despite heavy competition?
- How does a brand’s assortment depth compare to category norms?
- Are pricing gaps driven by strategy or by campaign participation?
For example, two apparently similar listings may differ in variant, pack size, shipping or voucher eligibility. Keep those conditions in the comparison key. A price gap alone does not establish the seller’s strategy, margin or product quality.
For a source-backed example, review the October 2024 Shopee Singapore Body Wash dataset and its worked discount check. The example listing names two bottle sizes but does not map each size to a price, showing why a displayed discount alone is not enough for a unit-price comparison.
- Category and Market Structure Analysis
Market structure analysis shifts focus from individual products to the shape of the category itself.
Within a defined collection scope, describe the observed distribution of listings and sellers:
- A small number of sellers accounts for a large share of observed listings.
- Many sellers contribute a small number of observed listings each.
- Assortment overlap increases within a matched product group, which merits further investigation rather than an automatic saturation label.
Specify whether concentration refers to listings, distinct products, units sold or revenue. A seller with many listings does not necessarily have the largest sales share. Rapid listing growth and flat prices can have several explanations; validate any saturation hypothesis against appropriate demand and supply evidence.
State the category definition, collection coverage and deduplication method beside the result. Conclusions from a sampled category should not be presented as estimates of the entire Shopee market.
The October 2024 Shopee serum archives for Vietnam, Thailand and Singapore illustrate why category checks matter: the Singapore file includes acne patches alongside serums and treatments. The guide shows how to separate product types and keep currencies and pack sizes comparable before summarizing a sample.
- Early Signal Detection Using Search and Listing Data
Search and listing observations can generate hypotheses for further research. Their ability to predict future sales must be evaluated; it should not be assumed from an apparent pattern.
Examples of observations worth checking include:
- A change in a product’s observed search position for a fixed query, location and collection context.
- More distinct, matched products appearing in a consistently sampled subcategory.
- Changes in search or engagement metrics from an authorized report, with that report’s population and definition recorded.
Higher visibility with fewer observed listings is a research lead, not proof that demand exceeds supply. Advertising, personalization, ranking changes, missing pages or a changed query can produce the same pattern. Check a second source and a later period before making a commercial decision.
When evaluating a forecasting rule, develop it on an earlier period and test it on later observations. Report unsuccessful signals as well as successful ones; avoid selecting examples after the outcome is known.
Bringing the Techniques Together
Individually, each technique reveals a specific aspect of marketplace behavior. Together, they form a cohesive analytical framework.
Trend analysis provides temporal context, competitive benchmarking clarifies relative positioning, market structure analysis defines the competitive landscape, and early signal detection highlights where attention should shift next. When applied collectively, these techniques allow Shopee data analytics to move beyond descriptive reporting and toward strategic insight.
Common Challenges in Shopee Data Analytics
Even with appropriate tools and methodologies, Shopee data analytics faces several recurring challenges:
- Data quality and normalization: match country, item, seller and variant identifiers where available; retain source units and currency. Distinguish missing values from zero and record any manual matching decisions.
- Campaign context and collection gaps: retain campaign flags, observation times and failed-page counts. More snapshots cannot compensate for systematically missing sellers or products.
- Scaling across markets: keep country-specific category mappings, time zones, currencies and report definitions explicit. Convert currencies only with a recorded rate/date and a clear reason.
To practice these checks, use the October 2024 Shopee beauty-supplement files for Vietnam and Singapore. The accompanying guide distinguishes blank brand labels, literal placeholders and zero reference prices, and explains why variant price ranges need a pack definition before unit-price comparisons.
Final Thoughts
Shopee data analytics works best when treated as a strategic capability, not just a collection of tools or dashboards. High-quality insights depend on the quality of data, the techniques applied, and the questions being asked. Tools only deliver value when they support a well-defined analytical process.
As Shopee data analysis matures, many teams recognize that sustaining this foundation at scale is often more challenging than the analysis itself. Instead of managing every layer internally, organizations choose to combine in-house analytics with specialized support for data acquisition and structuring. Leveraging dedicated Shopee data scraping services allows analytics teams to reduce operational complexity, maintain data consistency over time, and focus their efforts on interpretation, decision-making, and long-term marketplace strategy.
Leave a Reply