
Understanding ecommerce traffic statistics has become a baseline skill for anyone running an online business. But let’s be honest: many teams track traffic daily, build beautiful dashboards… and still fail to grow.
The problem isn’t the data itself; it’s how teams interpret and use it. High-performing stores don’t just monitor traffic; they read signals, link them to decisions, and act more quickly than others. It often begins with a strong data foundation, such as a well-structured ecommerce dataset that provides deeper insights rather than just surface-level numbers.
Key Ecommerce Traffic Benchmarks You Need to Know in 2026
Before diving into strategy, benchmarks help establish context, but only when they are interpreted correctly. Numbers on their own don’t mean much unless you understand what “good” actually looks like within your market.
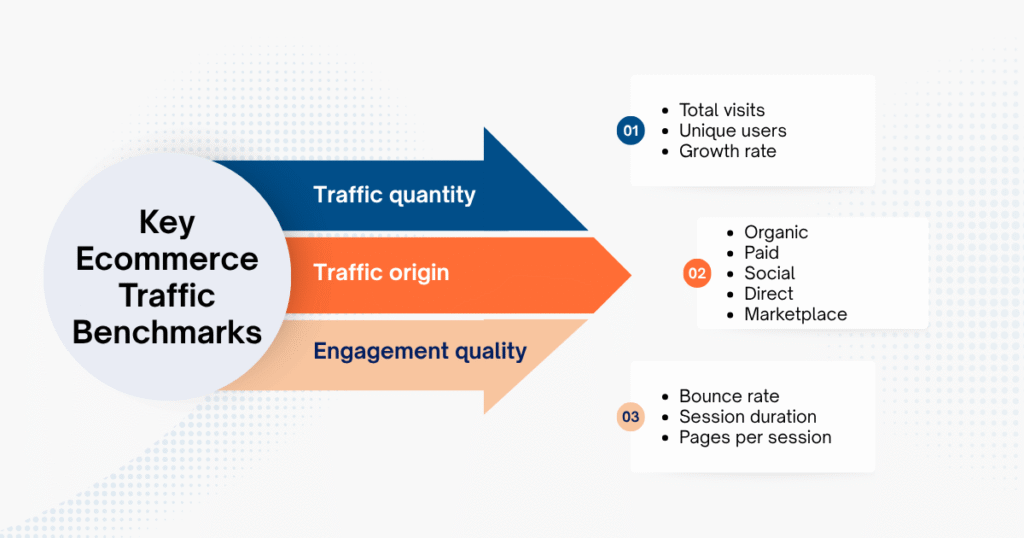
In 2026, ecommerce traffic statistics are typically viewed through three main lenses:
- Volume (traffic quantity)
- Source (traffic origin)
- Quality (engagement quality)
These three factors need to be considered together to accurately reflect performance, rather than looking at any single metric in isolation.
For example, most businesses track:
- Total visits, unique users, growth rate → to understand volume
- Traffic sources: organic, paid, social, direct, marketplace
- Engagement: bounce rate, session duration, pages per session
In Southeast Asia, mobile still clearly dominates, often accounting for 65–80% of traffic. More notably, platforms like Shopee and TikTok Shop are gradually capturing search intent that previously belonged to Google. But this is also where many teams misread ecommerce traffic statistics.
| Metric | Average Store | High-Performing Store |
| Monthly Traffic | High | Moderate |
| Conversion Rate | Low | High |
| Traffic Source | Paid-heavy | Diversified |
| Repeat Visitors | Low | High |
High-performing stores don’t necessarily have more traffic; they convert better, retain users more effectively, and rely less on expensive paid traffic.
Simply put: the real advantage isn’t more traffic, but higher-quality traffic. Something many people overlook when analyzing ecommerce traffic statistics.
What Ecommerce Traffic Statistics Can and Can’t Tell You
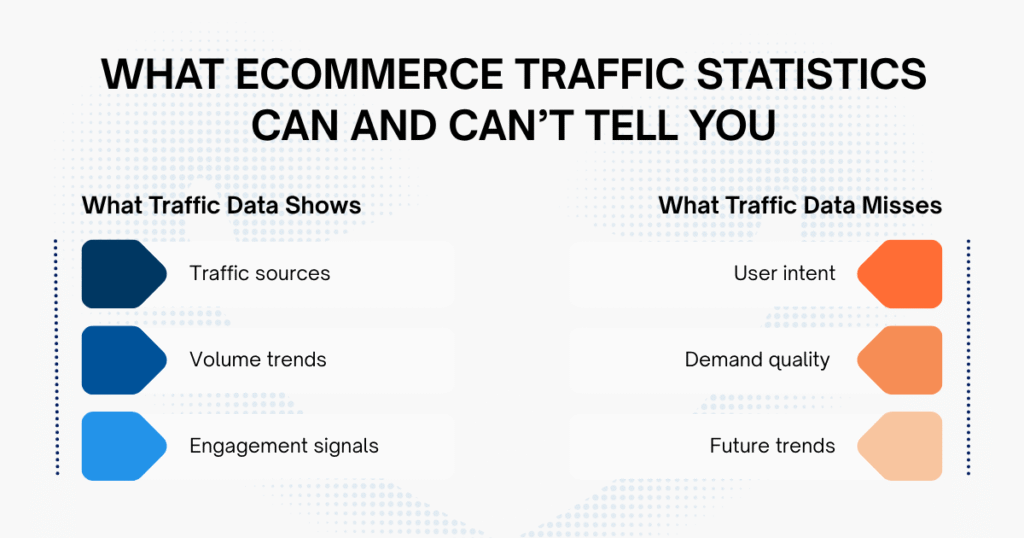
At first glance, ecommerce traffic statistics seem comprehensive. They show where visitors come from, how traffic changes over time, and which channels drive engagement.
But there’s a limit to what this data can reveal. Traffic metrics can tell you what is happening (for example, a spike in visits or a drop in bounce rate). What they cannot explain is why those changes occur, or what will happen next.
A sudden increase in traffic might look like growth. In reality, it could come from low-intent users, short-term campaigns, or even irrelevant audiences. In some cases, rising traffic can actually mask declining demand if conversion rates are falling at the same time.
Many teams get stuck here: they look at dashboards but fail to question the signals behind the numbers. The more useful way to think about ecommerce traffic statistics is this: they are descriptive, not predictive.
What High-Performing Ecommerce Stores Do Differently
The difference becomes clear when traffic is no longer treated as a standalone metric, but as part of a broader behavioral system. Strong ecommerce teams don’t analyze traffic in isolation. Instead, they connect it with demand signals, product performance, and market context to understand why certain patterns are emerging.
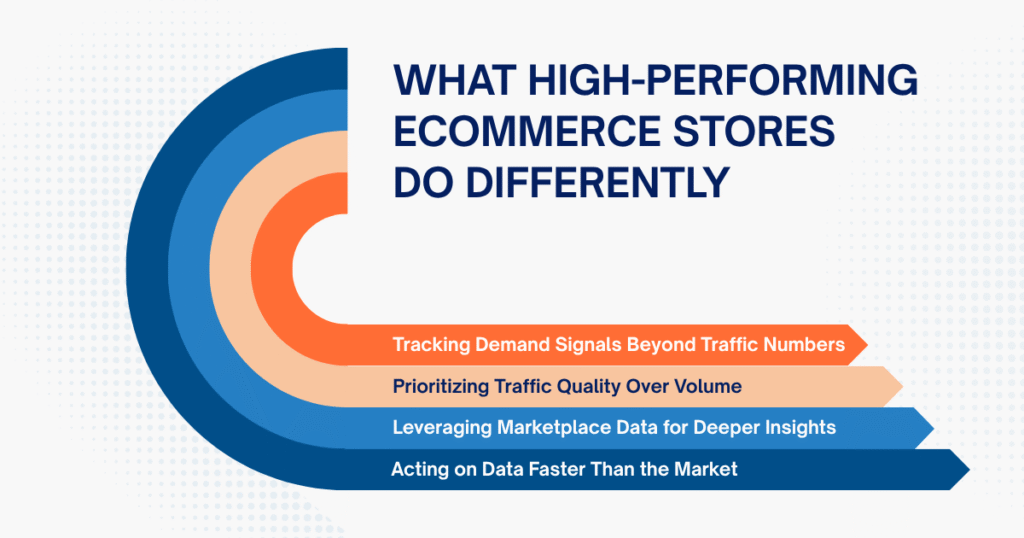
Tracking Demand Signals Beyond Traffic Numbers
Rather than focusing only on visits, high-performing stores look for early indicators of demand (signals that appear before traffic spikes). These often include search trends within marketplaces, shifts in product visibility, or sudden increases in keyword demand. Unlike traffic, which tends to lag, these signals provide an early view of where the market is moving.
Prioritizing Traffic Quality Over Volume
Another key difference lies in how traffic is evaluated. Instead of chasing higher numbers, top-performing teams focus on intent. They look closely at conversion rates by source, the balance between new and returning users, and how deeply customers engage with product pages.
This often leads to counterintuitive decisions. In some cases, reducing traffic volume actually improves overall performance because the remaining traffic is more relevant.
Leveraging Marketplace Data for Deeper Insights
Most traditional analytics tools focus on internal data: website behavior, user sessions, and conversion funnels. While useful, this view is inherently limited. What’s often missing is the external context: how competitors are performing, how products rank within marketplaces, and how demand shifts across categories.
That’s why incorporating ecommerce market data or platform-specific data becomes critical. It helps you see beyond your own store and understand the broader ecosystem your customers operate in.
Acting on Data Faster Than the Market
Perhaps the most overlooked advantage is speed. High-performing teams don’t wait for monthly reports. They continuously adjust pricing, shift budgets, and test new products based on real-time signals. Instead of static analysis, they operate in feedback loops, where data flows directly into decisions.
Turning Ecommerce Traffic Data into Growth Opportunities
Once you stop treating ecommerce traffic statistics as static reports and start reading them alongside market context, they become a powerful tool for decision-making. The key is not just knowing what the data says, but understanding how to use it to spot opportunities early.
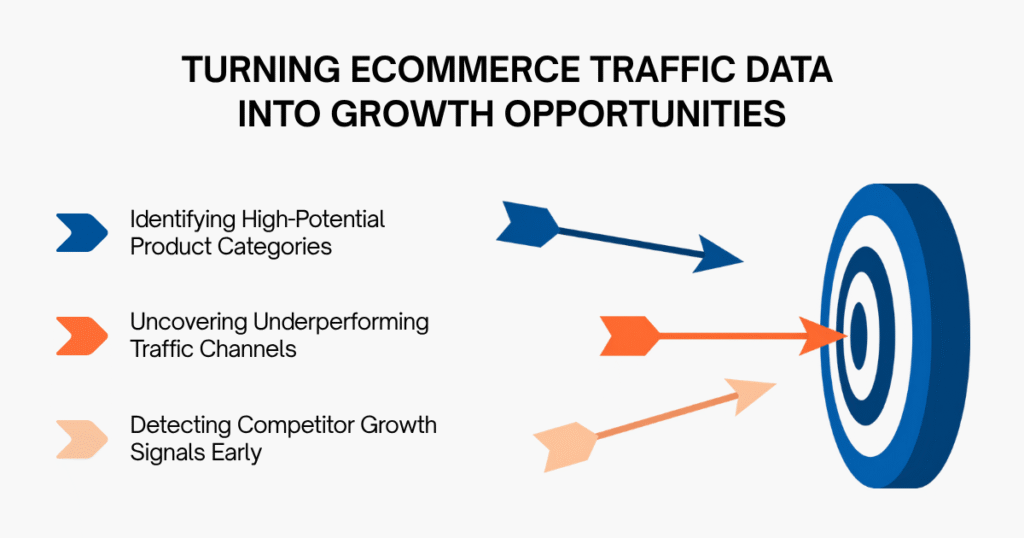
Identifying High-Potential Product Categories
Ecommerce traffic statistics can help you spot emerging product categories before they get crowded. This insight often comes from recognizing patterns across multiple signals, not just one metric.
For example, a category may be gaining traction when you start to see:
- Steadily increasing search volume across marketplaces
- A rapid rise in the number of sellers entering the space
- Higher listing engagement (clicks, reviews, wishlists, etc.)
Individually, these signals may not seem significant. But when they move together, they often indicate early-stage demand.
What matters here is timing. By the time revenue data shows a clear trend, the opportunity is often saturated. Combining ecommerce traffic statistics with marketplace signals gives you a much earlier entry point.
To do this effectively, track category-level movement, not just your own products. This shift can highlight opportunities that traditional analytics might miss.
Uncovering Underperforming Traffic Channels
Traffic growth can be misleading if it isn’t linked to outcomes. Many businesses invest heavily in channels that appear active but contribute little to revenue. This often happens when teams focus on top-line traffic without analyzing performance.
To avoid this, high-performing teams break traffic down into three layers:
- How much traffic each channel brings in
- How well that traffic converts
- How efficiently that channel generates revenue
This breakdown reveals the gap between “activity” and “value.” Some channels may attract high traffic but have low conversion and retention. Meanwhile, others might bring in less traffic but attract higher-quality customers with greater long-term value.
The goal here is not to maximize traffic, but to shift focus toward channels that truly drive growth. When viewed this way, ecommerce traffic statistics become less about reporting performance and more about guiding resource allocation.
Detecting Competitor Growth Signals Early
Another layer that most businesses overlook is how ecommerce traffic statistics can be used to understand competitors.
Your analytics tell only part of the story. To get a fuller view, combine your internal traffic data with external signals from ecommerce product datasets. This mix helps you spot subtle yet significant market changes. For example, you may notice:
- New products appearing repeatedly across multiple sellers
- Consistent price adjustments within a specific category
- Sudden increases in product visibility or ranking
These can be early signs that a competitor is scaling a product or that a category is heating up. When multiple competitors move in the same direction, it often signals a broader market shift.
Here lies a real opportunity. Instead of reacting to what customers are buying, you can anticipate what they will buy next based on competitor actions.
What Most Businesses Miss When Analyzing Ecommerce Traffic Statistics
Lots of teams have access to data, but they still manage to misinterpret ecommerce traffic statistics in ways that can be pretty costly.
One big issue is that they focus too much on big-picture numbers like total traffic or revenue, without digging deeper into what’s really going on. Others only look at their own analytics and ignore what’s happening outside their bubble – where the real demand is.
Timing is also a major factor. If you get your data too late, it’s basically useless. By the time you figure out what’s going on, the opportunity might be gone.
The biggest problem isn’t that businesses don’t have enough ecommerce traffic data; it’s that they don’t really understand what the data is telling them.
Scaling Your Traffic Analysis with Real-Time Marketplace Signals
The real difference between average and high-performing stores ultimately comes down to how data is used. Top-performing teams don’t just track ecommerce traffic statistics. They connect traffic with context, read signals earlier than the market, and act while others are still trying to interpret reports. That ability to move faster and with more confidence is what creates a sustainable advantage.
To achieve this, they combine ecommerce traffic statistics with real market signals, such as how products are trending across marketplaces, how competitors are adjusting pricing, or how demand is shifting at the category level. This combination transforms traffic from a passive metric into an active decision-making tool.
Solution providers like Easy Data support high-performing stores at this stage. Our e-commerce data scraping service provides well-structured, real-time marketplace data (continuously scraped on demand) that is ready for data-driven decision-making.
Now, businesses no longer merely react based on reports; instead, they can anticipate changes, adjust strategies earlier, and seize opportunities before they become obvious.
Conclusion
Most businesses believe they are data-driven ecommerce because they track traffic. But tracking alone doesn’t create an advantage. The real difference lies in how ecommerce traffic statistics are interpreted, connected, and applied. High-performing stores understand the limits of traffic data, enrich it with marketplace insights, and turn it into continuous action.
In a fast-moving ecommerce landscape, data is no longer just a report; it’s a system. And the businesses that win are the ones that know how to use that system better than everyone else.
Leave a Reply