

Ecommerce product data often reveals emerging market opportunities long before they become mainstream trends. Instead of relying solely on trending charts, businesses can use product, pricing, and supply-side data to identify early shifts in consumer demand and uncover growth opportunities before competitors do.
What Is Ecommerce Product Data?
Ecommerce product data refers to the collection of product-related information gathered from ecommerce platforms such as Shopee, Lazada, Amazon, and TikTok Shop. This data typically includes product information, pricing, sales performance, inventory levels, customer reviews, and other related attributes.
When collected and monitored consistently over time, ecommerce product data does more than show how a product is selling. It also helps businesses understand how the market is evolving.
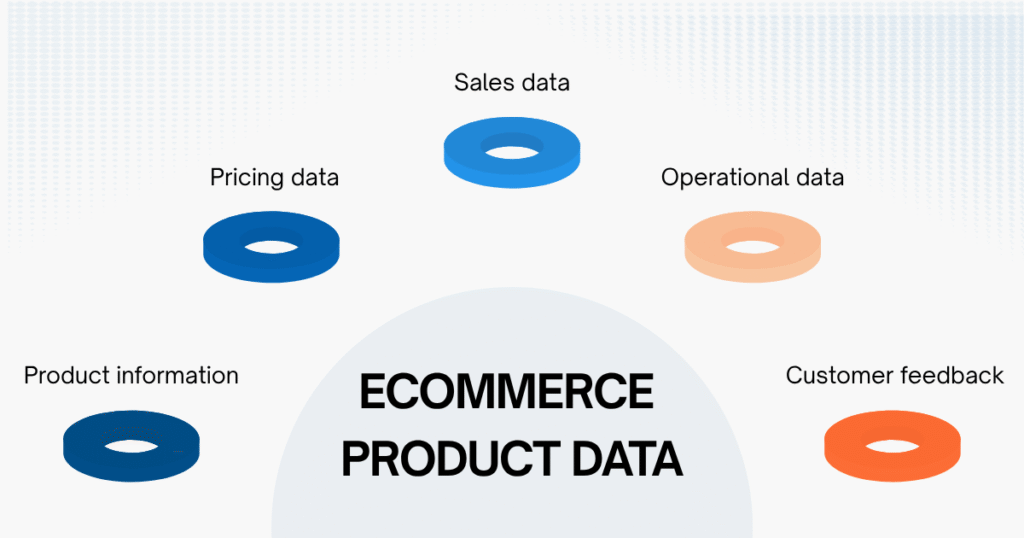
Common categories include:
- Product information: Product name, description, SKU, brand, and category.
- Pricing data: Listed price, promotional price, price history, and product variations.
- Sales data: Units sold, estimated revenue, and product performance.
- Operational data: Inventory levels, seller count, and product availability status.
- Customer feedback: Ratings, reviews, and review content.
Understanding Market Gaps and Their Strategic Value to Businesses
Market gaps are customer needs that are not being fully addressed by existing products in the market. They often emerge when consumer demand changes faster than brands or supply chains can adapt.
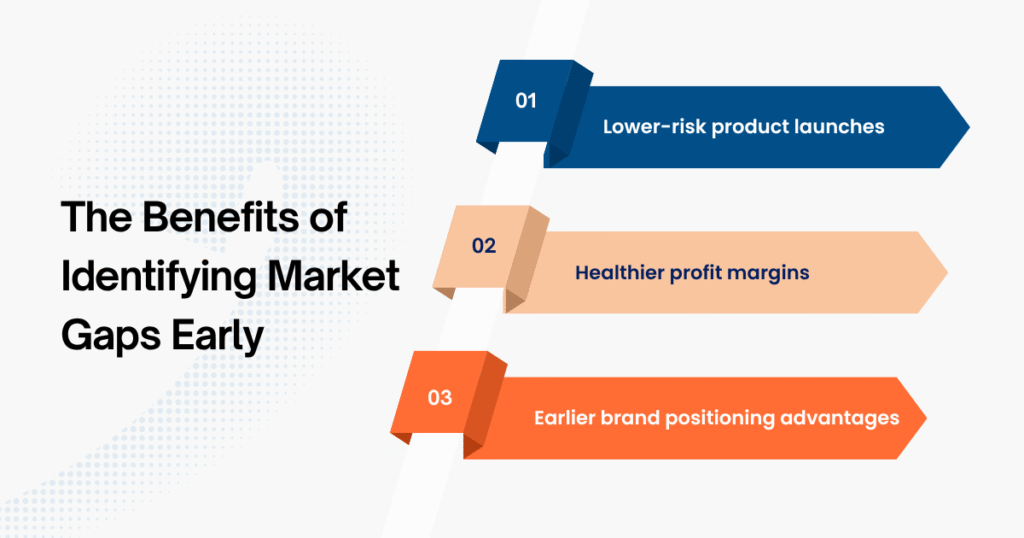
Analyzing ecommerce product data to identify market gaps early can provide several advantages:
- Lower-risk product launches: When competition is still limited, businesses have more room to test and refine products based on actual market demand.
- Healthier profit margins: Instead of competing in saturated markets, businesses can focus on segments with fewer competitors.
- Earlier brand positioning advantages: Companies that enter emerging segments first often have a better chance of becoming category leaders.
Why Ecommerce Product Data Often Detects Trends Earlier Than Trending Charts
Trending charts typically show what is already popular today. In contrast, ecommerce product data helps businesses observe changes that are gradually taking shape in the market.
Before a product becomes a trend, early signals often appear in the data, such as an increasing number of SKUs, more sellers entering a category, steadily rising sales within a product segment, or new attributes appearing more frequently in product titles (according to BigCommerce Ecommerce Predictive Analytics)
These signals reflect actual consumer demand and often emerge much earlier than trend reports or viral social media content.
How to Identify Market Gaps Using Ecommerce Product Data
To illustrate how ecommerce product data can be used to identify real-world market gaps, let’s examine a disposable diaper dataset collected by Easy Data from Shopee Thailand in March 2025.
Rather than relying on summary reports or trending charts, we will analyze raw ecommerce data to uncover signals that reveal emerging demand, market competition, and untapped growth opportunities.
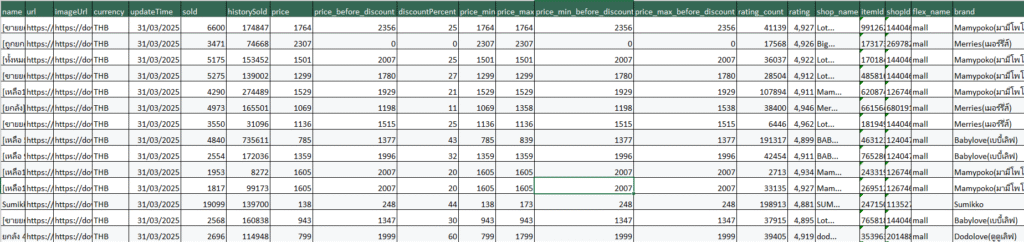
The dataset includes fields such as:
- Product name / product ID
- Brand
- Shop name / shop ID
- Historical sold
- Price & discount percent
- Rating
- Flex name (Shopee mall or non-mall)
Signal 1: Smaller Brands Are Still Generating Meaningful Sales
In Thailand’s diaper category, major brands such as MamyPoko, Pampers, BabyLove, and Goo.N account for a large share of total sales. However, a deeper analysis of products outside the top brands reveals that many lesser-known and local brands continue to generate stable sales over extended periods.
This suggests that purchasing decisions are not entirely driven by brand recognition. In some segments, consumers are willing to try new products if they offer the right combination of price, quality, and functionality.
Insight: When smaller brands can still generate meaningful sales, the market often remains open to new entrants. This suggests that competitive opportunities do not always require creating a completely new product. In some segments, businesses can gain market share through stronger branding and positioning.
Signal 2: Multiple Customer Segments Exist Within the Same Market
Comparing pricing and discount data across brands reveals significant differences in pricing strategies.
For example:
| Brand | Price (THB) | Discount |
|---|---|---|
| Pampers | 99 | 80% |
| Sunny Baby | 119 | 62–71% |
| MamyPoko | 257 | 56% |
| Goo.N | 279 | 0% |
Some brands compete through aggressive discounts and low prices, while others maintain premium pricing with minimal promotions.
Insight: The market is not made up of a single customer group. Alongside price-sensitive shoppers, consumers are willing to pay more for better quality, stronger brands, or superior product experiences. By analyzing pricing and sales data, businesses can identify price ranges where demand is strong but product options remain limited.
Signal 3: Sales Do Not Come Exclusively From Shopee Mall
One interesting observation from the dataset is that many products with strong sales and high ratings are sold by regular shops rather than Shopee Mall stores. This indicates that consumers do not always prioritize official stores. In many cases, they choose sellers based on pricing, response speed, promotional offers, or overall shopping experience.
Insight: If a brand’s sales are heavily distributed across third-party sellers rather than concentrated in its official store, this may indicate room for improvement in its distribution strategy. For businesses entering the market, partnering with established sellers that already have a stable customer base can often be more effective than building a sales channel from scratch.
Signal 4: Leading Sellers Control a Significant Share of Traffic
When grouping the dataset by shop ID, Easy Data found that certain shops appeared repeatedly across many top-selling products. Interestingly, these sellers often distribute multiple brands within the same category rather than focusing on a single brand. This suggests that they have built strong customer loyalty and significant visibility on the platform.
Insight: In many cases, the opportunity is not about launching another product but about choosing the right distribution partner. Identifying influential sellers within a category can significantly shorten time-to-market and reduce initial advertising costs.
Signal 5: Historical Sold Reveals Real Market Demand
Among all product data fields, “historical sold” is one of the most valuable because it reflects actual purchasing behavior. By combining historical sold with product titles and product attributes, businesses can identify which product characteristics are attracting the strongest market demand.
Examples include:
- Pants diapers
- Ultra-thin diapers
- Jumbo Pack
- Organic diapers
If a specific attribute appears increasingly often among top-selling SKUs, it is usually a sign that demand is growing.
Insight: Instead of waiting for a trend to appear on trending charts or become viral on social media, businesses can identify these signals much earlier through ecommerce product data.
The signals above represent only a small portion of what can be uncovered from ecommerce product data. If you’d like to explore this dataset yourself, you can download the sample dataset provided by Easy Data.
How Easy Data Helps Businesses Access Ecommerce Product Data at Scale
Market gap analysis is only effective when businesses have access to a complete and continuously updated ecommerce product dataset.
In reality, collecting product data from ecommerce platforms at scale is not easy. Data changes daily, product volumes are massive, and manual monitoring becomes nearly impossible when analyzing multiple categories or markets simultaneously.
Easy Data provides ecommerce data scraping solutions that help businesses collect and standardize data from Shopee, Lazada, and TikTok Shop across Southeast Asia.
- Product-level data collection: Data can be collected down to the individual SKU level, including fields such as Product ID, Shop ID, pricing, sales performance, inventory levels, customer ratings, and product attributes. This enables businesses to monitor markets at a granular level rather than relying solely on aggregated reports.
- Cleaned and standardized data: After collection, data is processed and standardized to make it analysis-ready. Outputs can be delivered in multiple formats, including CSV, Excel, JSON, or integrated directly into BI platforms and internal dashboards.
- Customized based on business needs. Every business has different data requirements. Easy Data supports custom datasets based on specific categories, brands, keywords, or markets while allowing flexible update frequencies, including daily, weekly, or near real-time delivery.
If your business is looking for a faster and more structured way to access market intelligence, the Easy Data team can help design a solution tailored to your analytical needs.
Conclusion
Market gaps rarely appear in obvious ways. More often, they first emerge through product data, pricing data, and purchasing behavior across ecommerce platforms. By continuously monitoring ecommerce product data, businesses can identify emerging demand, evaluate competitive intensity, and uncover growth opportunities before markets become more crowded.
This is why an increasing number of companies now view ecommerce product data as a critical component of market research and product development strategies.
Leave a Reply