
In 2026, ecommerce delivery is no longer just a logistics task, it directly impacts conversion, customer satisfaction, and profitability. That’s why tracking ecommerce delivery statistics has become essential.
However, many businesses still lack access to a complete ecommerce dataset, relying instead on fragmented data from platform dashboards. As competition grows on ecommerce platforms, this limited visibility makes it harder to consistently improve delivery performance.
- Delivery now directly impacts conversion and revenue, not just logistics.
- Key metrics: delivery speed, shipping cost, return rate, and last-mile performance.
- Platform data alone is incomplete; competitor and marketplace data reveal the real picture.
- Businesses that automate data collection can track performance, benchmark competitors, and optimize faster.
- With Easy Data, you get real-time ecommerce delivery statistics to act before others do.
Key Ecommerce Delivery Statistics You Should Know in 2026
Understanding ecommerce delivery statistics isn’t about collecting random numbers; it’s about spotting the patterns that actually influence buying behavior and operational efficiency. Here are the key data points that make a real difference in 2026.
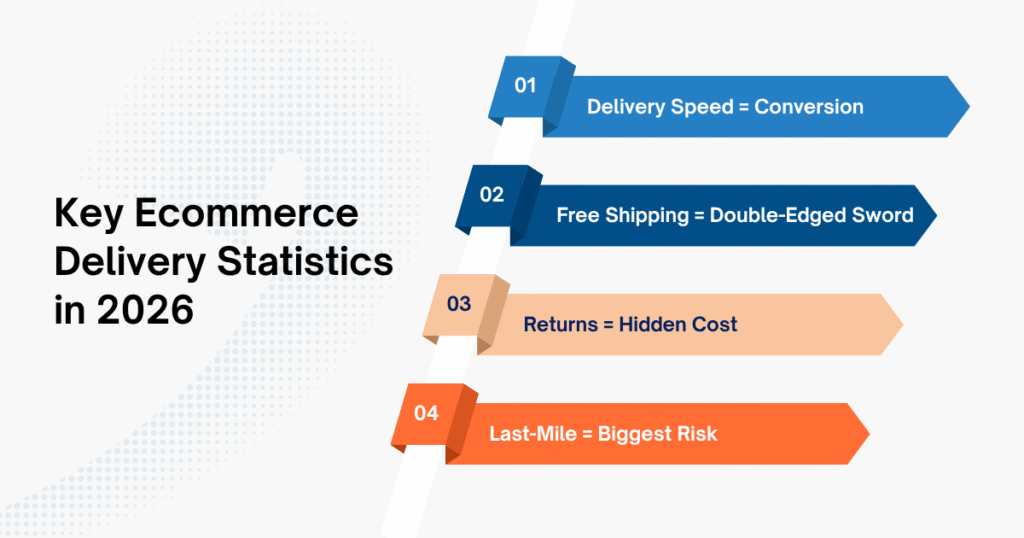
Delivery Speed Expectations
Across platforms like Shopee and TikTok Shop, customer expectations around delivery speed have tightened significantly. Same-day and next-day delivery are no longer seen as premium, they are quickly becoming the default.
In highly competitive markets like Indonesia, Thailand, or the Philippines, even a 1–2 day delay can push customers to switch to another seller offering faster fulfillment. This impact becomes even more obvious during high-traffic periods such as double-day campaigns (9.9, 11.11), payday sales, platform-wide flash sales, or mega campaign events driven by TikTok Shop.
Instead of viewing delivery speed as just a logistics metric, businesses should treat it as a direct lever for revenue growth. Faster delivery doesn’t just improve operations; it influences purchase decisions at the point of checkout.
Free Shipping Impact
Free shipping continues to be one of the strongest conversion triggers in ecommerce. However, many sellers underestimate its hidden cost.
On platforms like Lazada and Shopee, free shipping vouchers are usually only partially subsidized. Sellers still end up covering part of the cost, especially for bulky or cross-border items.
What this means in practice:
- Free shipping increases conversion
- But without proper tracking of ecommerce shipping data, it can quietly erode profit margins
To optimize this, businesses need visibility into:
- Shipping cost per order
- Conversion uplift from free shipping campaigns
Ecommerce Return Rate
Return rates vary significantly by category, but in fashion and electronics, they can reach double digits. In Southeast Asia, return behavior is also influenced by:
- Cash-on-delivery habits
- Product expectation gaps
- Delivery delays
Returns aren’t just a support issue; they’re a data and logistics problem. Without tracking return reasons and patterns, businesses miss opportunities to:
- Improve product listings
- Optimize delivery timelines
- Reduce reverse logistics costs
Last-Mile Delivery Performance
Last-mile delivery remains the most unpredictable and expensive part of the fulfillment process. In dense urban areas like Ho Chi Minh City or Jakarta, traffic congestion and fragmented courier networks create frequent delays.
What many businesses don’t realize is that:
- Most delivery failures happen in the last mile
- But most tracking systems don’t provide granular last-mile insights
Therefore, analyzing in-depth ecommerce delivery statistics becomes crucial not only for tracking performance but also for pinpointing exactly where the issues lie.
What Ecommerce Delivery Data You Should Be Tracking
Knowing the right metrics is more valuable than tracking everything. The table below outlines a practical framework to help businesses focus on data that actually drives decisions based on ecommerce delivery statistics.
| Data Category | Key Metrics | Why It Matters | Business Impact |
|---|---|---|---|
| Delivery Performance | On-time delivery rate, Avg delivery time | Measure fulfillment efficiency | Improve customer satisfaction |
| Shipping Behavior | Free shipping usage, Delivery preferences | Understand customer expectations | Optimize pricing & promotions |
| Returns & Reverse Logistics | Return rate, Return reasons | Identify product/logistics issues | Reduce operational costs |
| Competitive Data | Competitor delivery speed, estimated delivery time shown on listing, shipping fee comparison across sellers/platforms | Benchmark against competitors | Gain strategic advantage |
Most businesses in Southeast Asia already track internal metrics like delivery time or return rates. The real advantage, however, comes from external data: understanding how your delivery performance compares to other sellers on Shopee, Lazada, or TikTok Shop.
How Businesses Actually Use Ecommerce Delivery Statistics
Once the right data is identified, its value depends on how each role within the business uses it. Ecommerce delivery statistics are not just for logistics; they influence decisions across the entire organization.
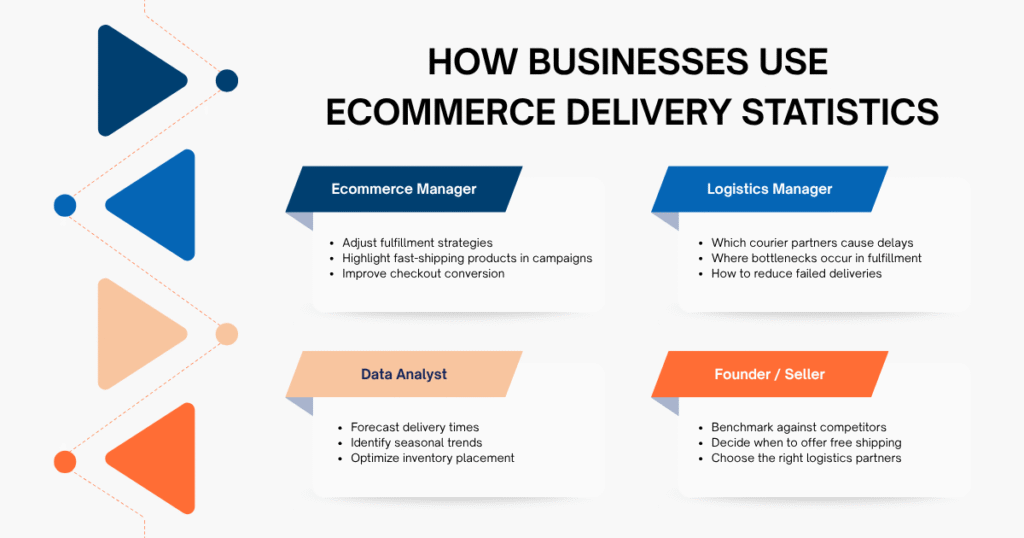
Ecommerce Manager
For ecommerce managers, delivery data directly impacts conversion rates. By analyzing delivery speed across different SKUs or regions, they can:
- Adjust fulfillment strategies
- Highlight fast-shipping products in campaigns
- Improve checkout conversion
Logistics Manager
Logistics teams rely on ecommerce delivery statistics to identify inefficiencies:
- Which courier partners cause delays
- Where bottlenecks occur in fulfillment
- How to reduce failed deliveries
Data Analyst
For analysts, ecommerce delivery statistics are a foundation for building dashboards and predictive models. They help:
- Forecast delivery times
- Identify seasonal trends
- Optimize inventory placement
Founder / Seller
For founders and independent sellers, delivery data becomes a competitive weapon. It enables them to:
- Benchmark against competitors
- Decide when to offer free shipping
- Choose the right logistics partners
How to Collect Ecommerce Delivery Data Automatically
There are multiple ways to collect ecommerce delivery data, but not all methods are scalable or complete. The table below compares the most common approaches.
| Method | How It Works | Pros | Cons | Best For |
|---|---|---|---|---|
| Platform Dashboard | Built-in analytics | Easy to access | Limited visibility | Beginners |
| Manual Export | CSV / Excel downloads | Free | Time-consuming, incomplete | Small teams |
| API Integration | Connect via platform APIs | Structured data | Requires technical resources | Tech teams |
| Web Scraping | Extract real-time data from platforms | Full data access | Needs specialized tools | Scaling businesses |
In practice, most Southeast Asian ecommerce platforms provide limited API access, especially for competitor data. This makes it difficult to:
- Track competitor delivery speed
- Monitor marketplace trends
- Collect large-scale data consistently
As a result, an increasing number of businesses are opting for automation methods such as web scraping for ecommerce to fill these data gaps and gain a more comprehensive view of the market.
Access Real-Time Ecommerce Delivery Statistics at Scale with Easy Data
By working with a web scraping service provider like Easy Data, businesses can access real-time ecommerce delivery statistics at scale across Shopee, Lazada, and TikTok Shop, enabling faster, data-driven decisions without relying on manual exports or incomplete platform data.
From Fragmented Data to Full Visibility
Easy Data’s e-commerce data scraping service helps businesses continuously monitor:
- Delivery speed across multiple sellers
- Shipping performance by region
- Competitor fulfillment trends
This is particularly valuable on platforms like Shopee, TikTok Shop, or Lazada, where competitive dynamics change daily.
Turning Data into Actionable Insights
With structured delivery data by Easy Data, businesses can:
- Identify which competitors offer faster shipping
- Adjust pricing strategies based on delivery performance
- Optimize logistics partners based on real outcomes
For example, a seller in Indonesia might find that competitors offering 2-day delivery consistently outperform those with 4-day delivery (even when their prices are slightly higher). Insights like this can directly inform pricing, logistics, and campaign strategies.
Why Automation Matters
Manual tracking simply cannot keep up with the scale and speed of ecommerce today. Easy Data’s automated data scraping service ensures:
- Real-time updates
- Cross-platform visibility
- Scalable data pipelines
Future Ecommerce Delivery Trends You Should Track
While current ecommerce delivery statistics provide a snapshot of performance, future trends indicate where the industry is heading.
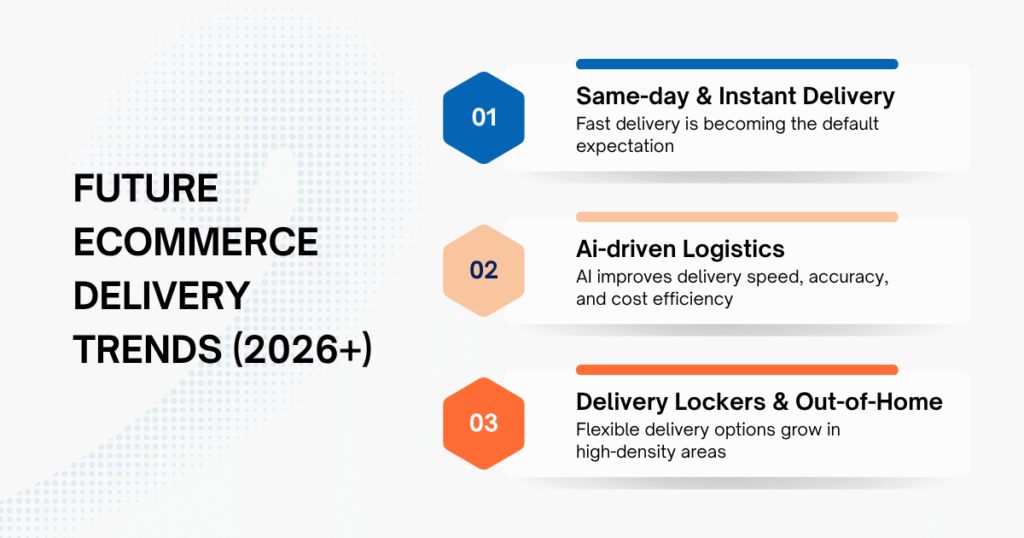
- Same-day & instant delivery: Fast delivery is quickly becoming the standard, especially in urban Southeast Asia. Platforms are investing heavily in fulfillment networks to support this shift.
- Ai-driven logistics: AI is playing a growing role in logistics, helping predict delivery times, optimize routes, and reduce failed deliveries. The result is better efficiency at lower cost.
- Delivery Lockers & Out-of-Home (OOH): Alternative delivery methods such as lockers are gaining traction, especially in high-density areas where home delivery is less efficient.
Get the free sample dataset from Easy Data to unlock the latest e-commerce delivery trends
Conclusion
Ecommerce delivery statistics only create value when you can clearly see them and act on them. Without the right data, it’s difficult to know what’s working and what needs improvement. By moving beyond incomplete dashboards and adopting automated data collection, you gain a real-time view of the market, benchmark competitors more effectively, and make faster, more confident logistics decisions.
What is a good delivery time for ecommerce?
A good delivery time depends on the market, but in Southeast Asia, 1–3 days is generally considered competitive for domestic shipping.
How to track ecommerce delivery performance?
You can track delivery performance using platform dashboards, APIs, or automated data scraping methods like web scraping for more comprehensive insights.
What data improves shipping efficiency?
Key data includes on-time delivery rate, average delivery time, return rate, and last-mile performance.
How to reduce ecommerce delivery cost?
By analyzing delivery data, businesses can optimize courier selection, reduce failed deliveries, and refine free shipping strategies.
Leave a Reply