

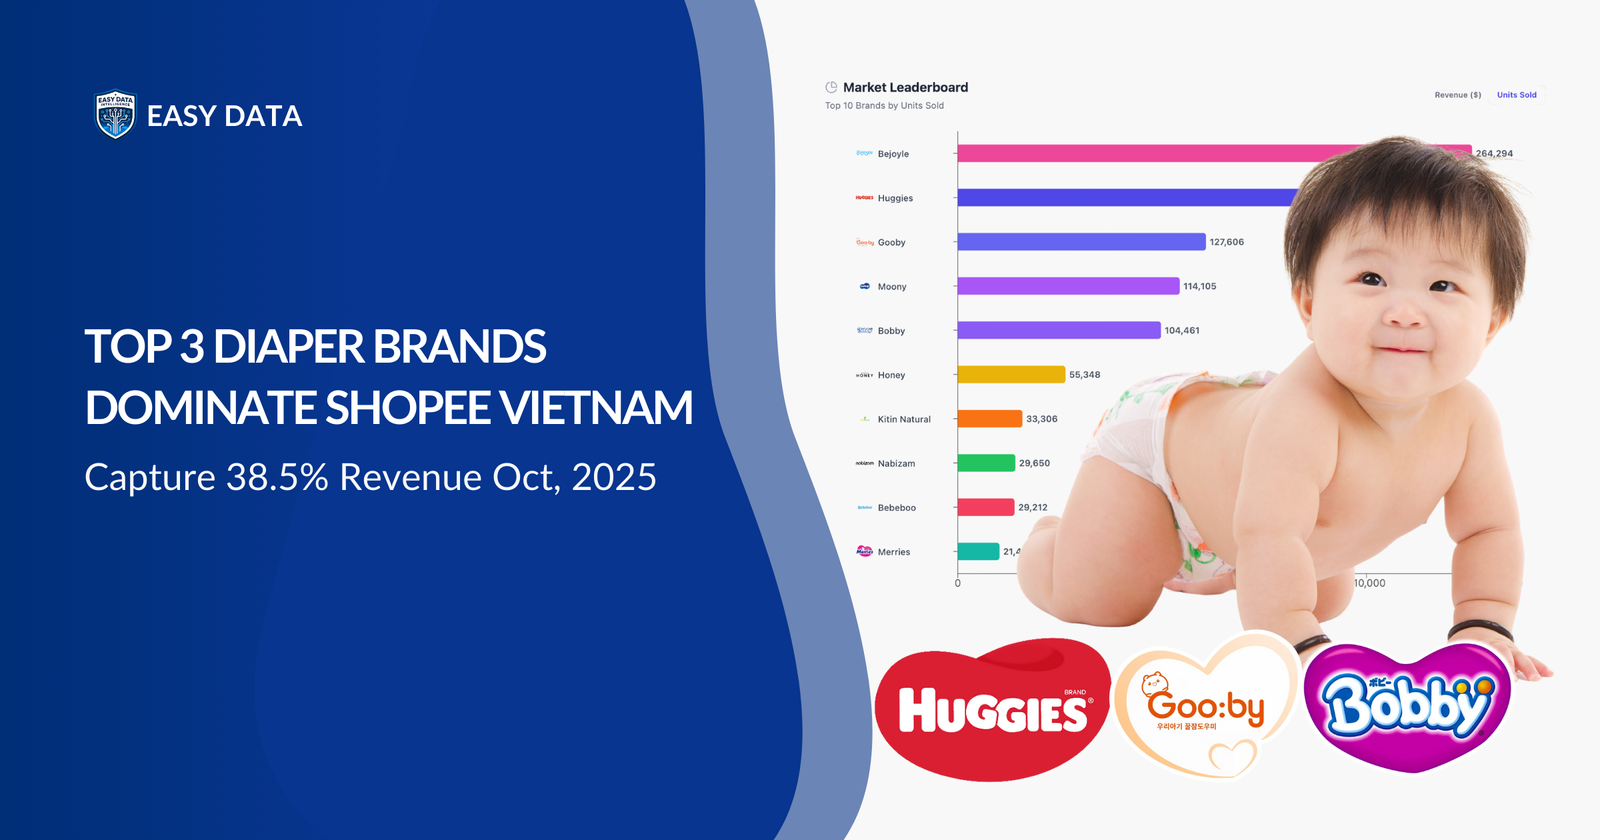
This article reviews the previously reported October 2025 diaper brand figures for Shopee Vietnam and identifies the information needed to interpret them. It focuses on Huggies, Gooby and Bobby; the figures do not by themselves explain customer preferences or the causes of brand performance.
The published summary reports shares of 15.64% for Huggies, 12.82% for Gooby and 10.00% for Bobby, attributed to EasyData’s market insight. Together, these reported shares total 38.46%, or 38.5% rounded to one decimal place. This is an arithmetic check of the reported figures, not independent verification of their underlying revenue or category coverage.
Methodology note: This article does not document the underlying listing records, inclusion and exclusion rules, brand matching, collection schedule, currency, conversion date, unit or pack basis, weighting or revenue model needed to reproduce the figures. Read the charts and values below as previously reported observations and estimates. Marketplace listing prices and displayed sales counters do not establish completed-order revenue; transaction analysis needs appropriately authorized records and a clear treatment of returns, cancellations and discounts.
Reported Brand Shares and Their Scope
The three reported shares offer a starting point for comparison. Interpreting them as shares of the whole category requires confirmation that each uses the same population, reporting period and denominator.
2.1 Reported Shares (October 2025)
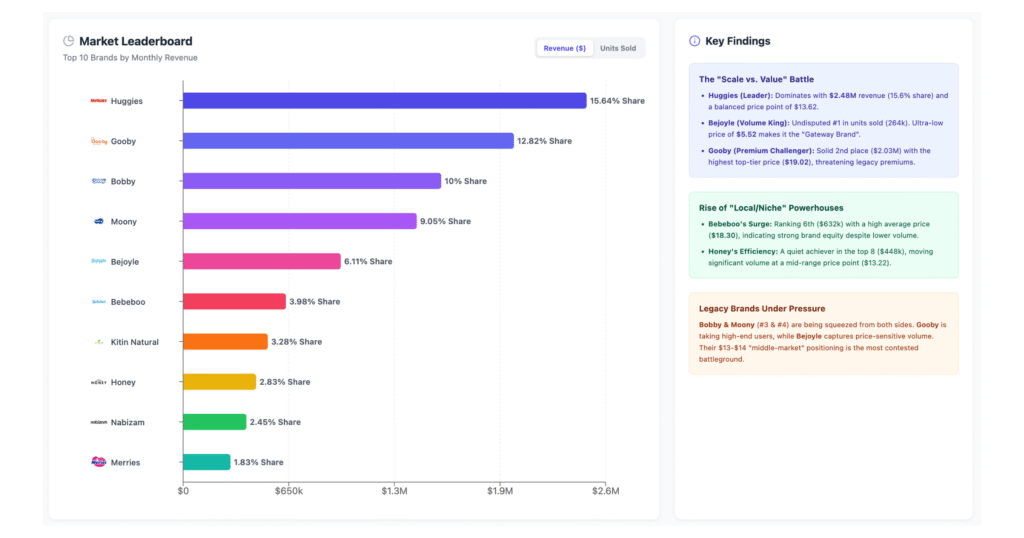
The October 2025 summary lists the following brand shares:
- Huggies — 15.64% reported share
- Gooby — 12.82% reported share
- Bobby — 10.00% reported share
Together, the three reported shares add to 38.46% (15.64% + 12.82% + 10.00%), or 38.5% rounded to one decimal place. If they use a complete, common denominator, the remaining share is 61.54%. These percentages alone do not establish distinct customer segments or show whether one brand replaces purchases from another.
2.2 Positioning to Verify
The original summary describes the following positioning; verifying it requires comparable product and variant records and explicit price-tier definitions:
- Huggies: described in the original summary as spanning mid-range and premium offers. Validate the tier definitions and product mix before treating this as a comparison of like-for-like products.
- Gooby: described in the original summary as premium-positioned. Product prices alone do not establish perceived quality or customers’ willingness to pay.
- Bobby: described in the original summary as mid-range. Testing this description requires the same price-tier rules and product units used for the other brands.
To test these positioning descriptions, compare like-for-like product types, pack sizes, variants and observation dates. Aggregate brand shares cannot establish customer switching or the effect of a positioning strategy.
Brand Comparisons: Reported Figures and Research Questions
The brand sections below distinguish reported price figures from questions for further research. Customer loyalty, product safety, profitability and the causes of purchasing behavior require additional evidence beyond marketplace listing observations.
Huggies: Pricing and Product Mix
- Product mix: Group Huggies listings by product type, pack size and variant, then compare price tiers using the same definitions across brands.
- Customer research: Study satisfaction and repeat purchasing with a defined customer study or authorized order history.
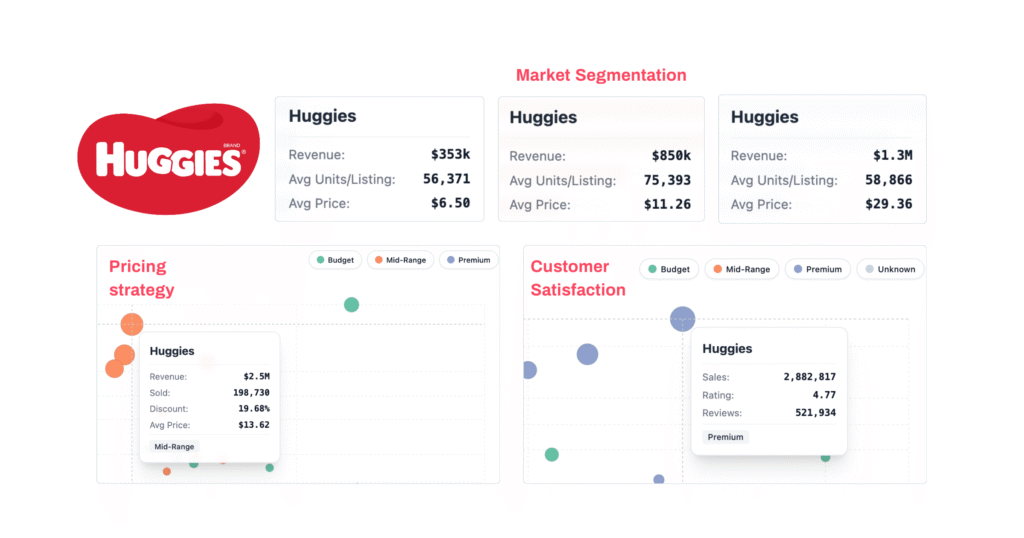
- Reported pricing: The original summary gives Huggies an average price of $13.62 and discounts of approximately 19–20%. Compare matched products and collection dates when exploring changes in prices or promotions.
Gooby: Pricing and Product Mix

- Product mix: Compare Gooby’s pack sizes, variants and prices with matched offers from other brands to examine the reported premium positioning.
- Customer research: Use a customer study or authorized repeat-order analysis to explore satisfaction and the reasons buyers choose Gooby.
- Reported pricing: The original summary gives Gooby an average price of $19.02 and discounts of approximately 19%. Its reported average price is the highest of these three brands; a like-for-like comparison can help separate product mix from price differences.
Bobby: Pricing and Product Mix
- Product mix: Assess Bobby’s reported mid-range position by comparing matched product types, pack sizes and variants under the same tier definitions.
- Customer research: Examine familiarity, satisfaction and repeat purchasing through a customer study or authorized order data.
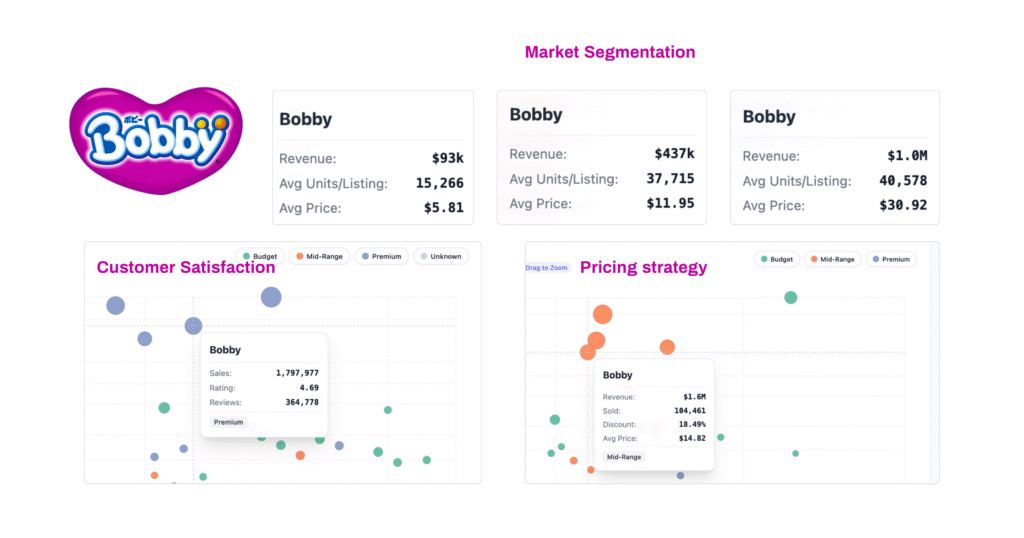
- Reported pricing: The original summary gives Bobby an average price of $14.82 and discounts of approximately 18%. Its reported average lies between Huggies and Gooby; compare matched offers to understand how pack size and variant mix affect this result.
How to Use These Figures
The reported shares add to 38.46%, or 38.5% rounded to one decimal place. The reported prices and discounts can help frame a comparative study once their source coverage, calculation methods, currencies and product units are confirmed.
To assess why customers choose a brand, combine the defined marketplace observations with suitable evidence, such as a documented customer study, authorized repeat-order data or an appropriate experiment. Brand share and average price alone do not demonstrate loyalty, marketing effectiveness or a causal effect of pricing.
For a reproducible example of source records and quality checks, explore the public Shopee Thailand diaper sample. That sample covers a different country and date and does not validate the October 2025 Vietnam figures. For your own study, discuss a custom Shopee data collection tailored to your research questions.
Leave a Reply