
Shopee SEA diaper market reached a total value of USD 53.8 million in October 2025, with more than 6.7 million units sold across the region. Behind this headline scale, however, lies a highly fragmented and intensely competitive landscape, involving over 1,100 active brands competing for mass-market demand.
This report analyzes Shopee marketplace data to examine how market size, pricing dynamics, brand concentration, and maturity levels differ across SEA countries. The findings highlight why Southeast Asia cannot be treated as a single homogeneous market and why diapers represent a strong indicator category for understanding broader FMCG and Baby Care competition in the region.
Why Shopee Data Matters for the SEA Diaper Market
To understand competitive dynamics in Southeast Asia, the choice of data source is critical. Shopee plays a central role in the region’s ecommerce ecosystem, particularly in FMCG and Baby Care categories.
Shopee’s high purchase frequency, repeat buying behavior, and intense seller competition make its marketplace data a close reflection of mass-market consumer behavior. As a result, Shopee data offers a reliable lens into real demand patterns rather than isolated or anecdotal signals.
Why Diapers Are a Strong Indicator Category
Within this context, diapers stand out as a structurally informative category. Demand for diapers is stable, non-seasonal, and recurring, allowing the data to surface long-term market patterns instead of short-term fluctuations.
At the same time, diaper buyers are highly price-sensitive while still exhibiting brand loyalty, particularly when quality and safety are involved. The category also hosts a diverse mix of global brands, local brands, and private labels, creating a competitive environment that clearly exposes how brands compete, scale, and sustain share.
Analyzing diaper data on Shopee therefore provides insight not only into a single product category, but into broader dynamics such as price elasticity, brand strength, and market maturity across Southeast Asia.
Dataset Scope and Analytical Frame
Before examining market outcomes, it is necessary to clarify the scope and analytical boundaries of the dataset underpinning this analysis.
This study is based on the Shopee SEA Diaper Market Overview (Oct 2025) – by Easy Data, which captures a one-month snapshot of marketplace activity. While the timeframe does not aim to describe long-term trend behavior, the dataset is sufficiently large and granular to assess overall market structure, competitive intensity, and cross-country differences across Southeast Asia.
Dataset Parameters:
- Region: Southeast Asia
- Timeframe: October 2025
- Data source: Shopee marketplace data
- Core metrics: Revenue, units sold, average selling price (ASP), active brands
This analytical frame enables a structural view of the diaper category across markets, focusing on scale, fragmentation, and pricing dynamics rather than short-term fluctuations or seasonality effects.
SEA Diaper Market Snapshot (October 2025)
At a regional level, the Shopee SEA diaper market in October 2025 recorded:
- Total revenue: USD 53.8 million
- Total units sold: 6.7 million
- Average selling price: USD 11.45 per unit
- Active brands: 1,129
These figures point to a market with large absolute scale but extreme fragmentation. With more than 1,100 brands participating, revenue is distributed across a wide field of sellers rather than concentrated among a small group of leaders. While total market size is significant, the share captured by any individual brand is structurally constrained.
The relatively low average selling price confirms that diapers on Shopee remain a mass-market category, where revenue growth is driven primarily by volume rather than premium pricing. Expansion at scale depends on selling more units, not on raising average prices across the market.
At the same time, monthly sales volume of 6.7 million units highlights the category’s stable and repeat-driven demand, reinforcing its value as a lens for observing price competition and brand structure in FMCG ecommerce.
Revenue Distribution by Country
Although the regional market is large, revenue distribution across countries is highly uneven.
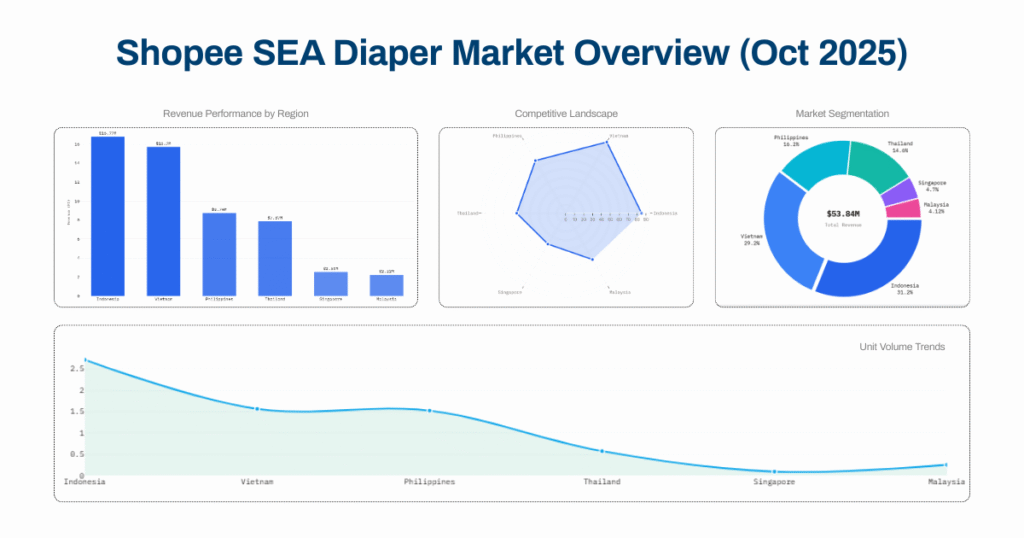
In October 2025, Indonesia and Vietnam together accounted for roughly 60% of total Shopee SEA diaper revenue. The remaining share was distributed across Thailand, the Philippines, Malaysia, and Singapore, each contributing at a much smaller scale.
This concentration indicates that regional growth is driven by a limited number of core markets rather than evenly across Southeast Asia.
Based on revenue contribution, markets can be grouped as follows:
- Core volume markets: Indonesia, Vietnam
- Secondary markets: Thailand, Philippines, Malaysia
- High-value niche market: Singapore
This structure reinforces a critical insight: there is no single “SEA diaper market.” Each country plays a distinct role in the regional ecosystem, requiring country-specific analysis and strategy.
Market Maturity Indicators by Country
Market maturity can be assessed by examining revenue, unit volume, and listing density together. This reveals how demand and competition interact within each national marketplace.
| Local Revenue | Local Units | Market Share | Listing Count | |
| Indonesia | $16.77M | 2.71M | 31% | 8.994 |
| Vietnam | $15.7M | 1.56M | 29% | 6.173 |
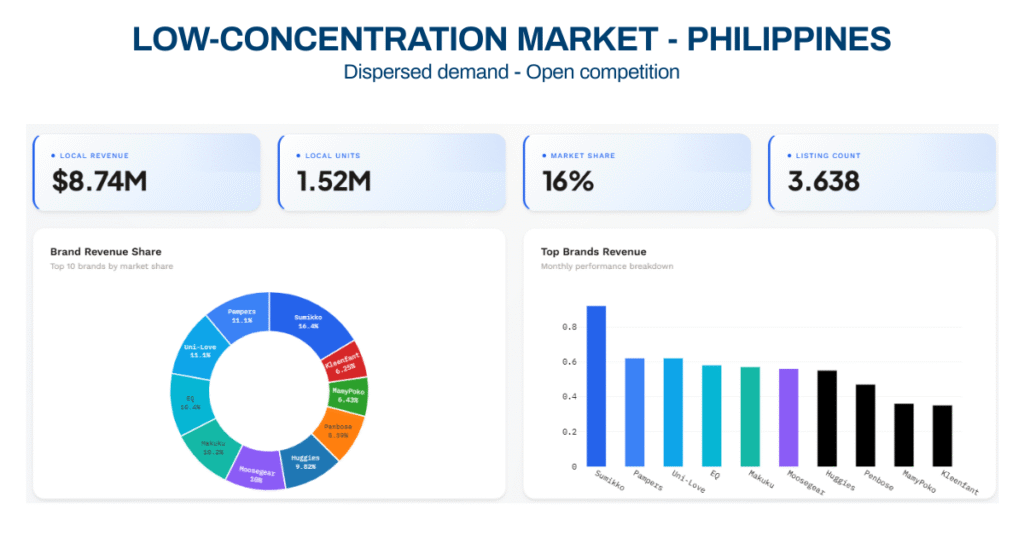
| Philippines | $8.74M | 1.52M | 16% | 3.638 |
| Thailand | $7.87M | 0.57M | 15% | 1.424 |
| Singapore | $2.53M | 0.09M | 5% | 972 |
| Malaysia | $2.22M | 0.25M | 4% | 660 |
Volume-Driven Mature Markets
Indonesia and Vietnam are the largest markets in absolute terms, but they also exhibit the highest competitive density.
- High demand attracts dense supply (Indonesia: 8,994 listings; Vietnam: 6,173 listings)
- Revenue and volume are spread across many listings
- Competition for mass-market consumers is intense
These characteristics define volume-driven mature markets (large – stable) but increasingly difficult environments for differentiation and scalable share growth.
Secondary Scale Markets
The Philippines and Thailand operate at a mid-tier scale, but with different competitive structures.
- The Philippines shows high listing density relative to its volume
- Thailand maintains a leaner supply structure despite similar revenue
These are secondary scale markets where demand is established, but maturity and competitive pressure vary by country.
Small-Scale and Niche Markets
Singapore and Malaysia are the smallest markets in the region.
- Singapore combines low volume with high listing density
- Malaysia shows a more concentrated supply structure
Both fall into small-scale or niche market profiles (limited in regional impact), yet still competitive at the marketplace level.
Brand Concentration and Competitive Structure
Brand concentration provides an initial lens into how competitive a market truly is. By examining how brands are distributed across a category (whether dominated by a few large players or fragmented among many smaller ones), organizations can quickly assess the underlying competitive structure. This snapshot helps contextualize market maturity, entry barriers, and the balance of power before diving into deeper brand-level dynamics.
| Indonesia | Vietnam | Philippines | Thailand | Singapore | Malaysia | |
| Market share of top 3 brands | 66.0% | 38.7% | 24.6% | 61.9% | 61.3% | 42.2% |
| Revenue concentration level | Low | Moderate | High | Low | Low | Moderate |
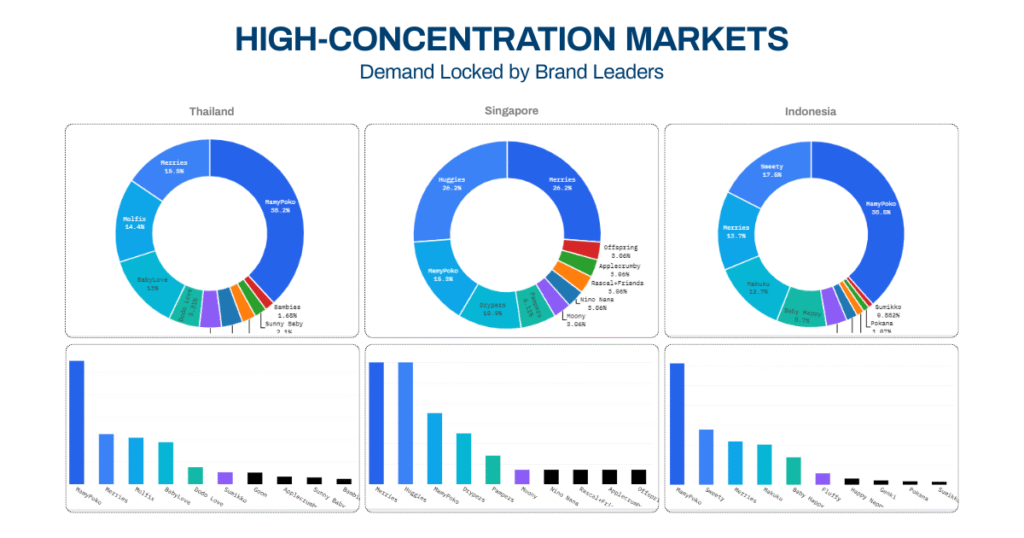
High-Concentration Markets – Demand Locked by Brand Leaders
Indonesia, Thailand, and Singapore show high top-3 brand share (over 60% in some cases), indicating:
- Strong brand loyalty
- Stable purchasing behavior
- Low willingness to experiment with new brands
In these markets, competition is driven more by trust and brand equity than by price alone.
Low-Concentration Markets – Open Competition
The Philippines stands out as a low-concentration market, where demand is widely distributed and no brand dominates. This creates a more accessible entry environment for new or challenger brands.
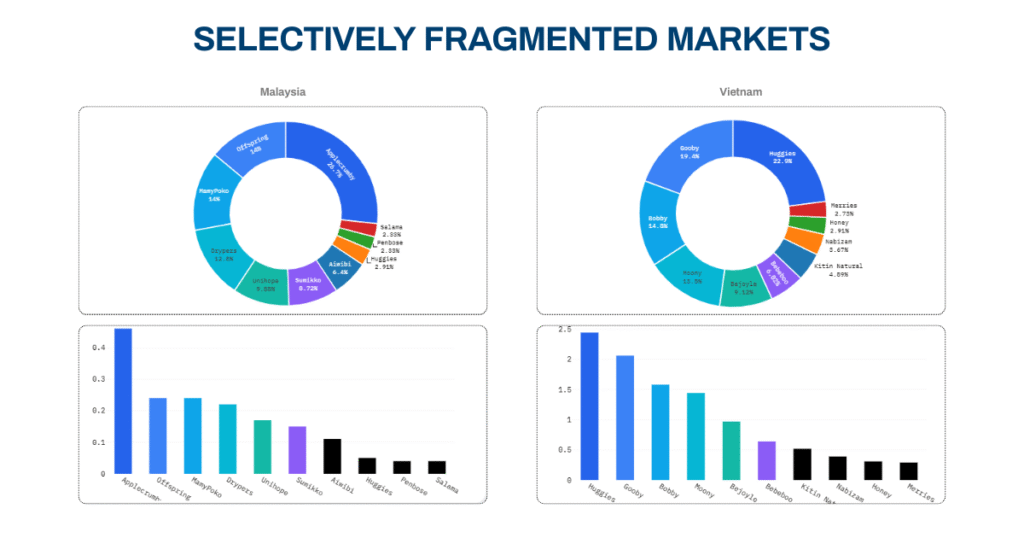
Selectively Fragmented Markets
Vietnam and Malaysia occupy a middle ground. Brand leaders exist but do not fully control demand, creating layered competition where new entrants must rely on clear positioning rather than price alone.
Pricing Dynamics Across SEA Markets
| Country | Revenue (USD) | Volume (Units) | ASP (USD / unit) |
| Indonesia | $16.77M | 2.71M | $6.19 |
| Vietnam | $15.70M | 1.56M | $10.06 |
| Philippines | $8.74M | 1.52M | $5.75 |
| Thailand | $7.87M | 0.57M | $13.81 |
| Singapore | $2.53M | 0.09M | $28.11 |
| Malaysia | $2.22M | 0.25M | $8.88 |
Pricing patterns differ sharply across the region.
- Low ASP, high volume: Indonesia, Philippines
- High ASP, low volume: Singapore, Thailand
- Mid-range ASP: Vietnam, Malaysia
Two key insights emerge:
- Low prices do not guarantee easier market entry, as competition is often fiercest in volume-driven markets.
- High ASP does not automatically signal premium positioning; sustainability still depends on brand strength and consumer trust.
Strategic Observations from the Dataset
Even within a single-month snapshot, Shopee data reveals that Southeast Asia is a collection of structurally different markets, not a unified region.
Marketplace data enables organizations to:
- Compare market attractiveness across countries
- Identify high-volume but hard-to-enter markets
- Detect pricing gaps and competitive misalignment
Reading pricing, structure, and brand data together allows teams to ask the right strategic questions early, before committing significant resources.
Conclusion
The Shopee SEA diaper market is large, mass-oriented, and intensely competitive. Indonesia and Vietnam function as volume engines, while Singapore represents a smaller but higher-value niche. The region as a whole cannot be approached with a single strategy.
When interpreted correctly, Shopee marketplace data clarifies not only where demand exists, but where sustainable growth is structurally possible and where it is not.
Leave a Reply