
Introduction
In the fast-paced world of ecommerce, understanding consumer behavior and market dynamics is more crucial than ever. The success of any online business hinges on its ability to effectively track and analyze data. Tracking ecommerce data not only helps businesses gauge their performance but also provides insights that can lead to informed decision-making and strategic planning. With the right approach, ecommerce data can unveil patterns, preferences, and pain points, enabling businesses to enhance customer experiences, optimize marketing strategies, and ultimately drive sales.
In this guide, we will explore the intricacies of tracking ecommerce data, from understanding its types and importance to the metrics that matter, the tools available, and the best practices for implementation. Whether you are a small business owner or part of a larger organization, this comprehensive overview will equip you with the knowledge to harness the power of data in your ecommerce endeavors.
Understanding Ecommerce Data
What is Ecommerce Data?
Ecommerce data refers to the information collected from online transactions and user interactions on an ecommerce website. This data encompasses a variety of metrics and dimensions, including:
- Sales Data: This includes total revenue, average order value, transaction counts, and product performance. Sales data provides insights into how well a business is performing financially and which products are driving revenue.
- Customer Behavior Data: This data captures how customers navigate your website, including their browsing patterns, the time spent on pages, and the actions taken (e.g., clicks, add-to-cart events). Analyzing this data helps businesses understand customer preferences and improve user experience.
- Traffic Source Data: Understanding where your visitors are coming from is crucial for evaluating the effectiveness of marketing efforts. This data includes organic search, paid ads, social media traffic, and direct visits.
- Inventory Data: This includes information on stock levels, product availability, and sales velocity. Monitoring inventory data is essential for effective supply chain management and ensuring that popular products are always in stock.
- Marketing Data: This data includes metrics related to marketing campaigns, such as click-through rates, conversion rates, and return on ad spend. Analyzing marketing data helps optimize promotional strategies.
Why Tracking Ecommerce Data is Essential
Tracking ecommerce data is fundamental for several reasons:
- Informed Decision-Making: Businesses can make data-driven decisions based on actual customer behavior rather than relying on gut feelings or assumptions. This leads to more effective strategies and resource allocation.
- Enhanced Customer Experience: By understanding how customers interact with your website, you can identify areas for improvement. Tailoring experiences based on data insights can lead to higher customer satisfaction and loyalty.
- Identifying Trends: Analyzing historical data allows businesses to spot trends over time. This can inform inventory management, marketing strategies, and product development.
- Optimizing Marketing Efforts: Tracking which marketing channels are most effective helps businesses allocate resources wisely. By focusing on high-performing channels, businesses can increase their return on investment (ROI).
- Measuring Performance: Regularly monitoring ecommerce data helps businesses evaluate their performance against goals and benchmarks. This enables quick adjustments to strategies and operations.
Key Metrics to Track in Ecommerce
Tracking the right metrics is crucial for gaining actionable insights. Here are some of the essential metrics every ecommerce business should monitor:
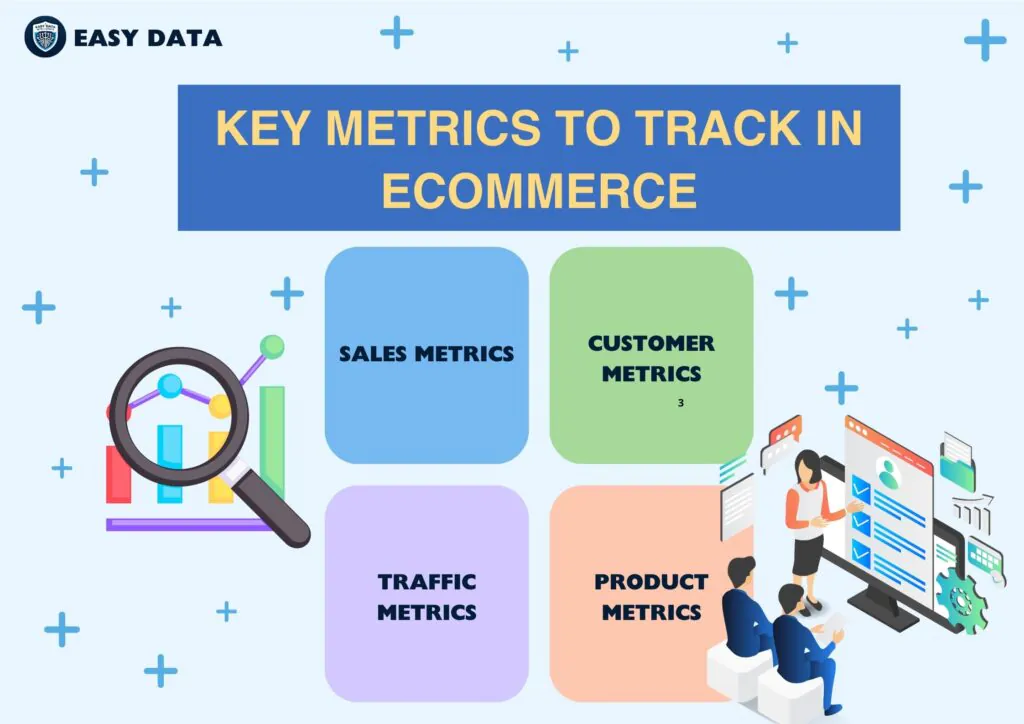
Sales Metrics
- Revenue: The total income generated from sales within a specific period is the primary measure of business performance. It provides insight into the financial health of the business.
- Average Order Value (AOV): AOV is calculated by dividing total revenue by the number of orders. This metric helps businesses understand customer purchasing behavior and can indicate how well upselling or cross-selling strategies are working.
- Conversion Rate: The percentage of visitors who make a purchase is crucial for evaluating the effectiveness of your website and marketing strategies. A low conversion rate may indicate issues with the website, such as a confusing layout or high shipping costs.
- Sales Growth Rate: This metric indicates how quickly sales are increasing over time. It can be calculated on a monthly, quarterly, or yearly basis, providing insights into the business’s growth trajectory.
Customer Metrics
- Customer Lifetime Value (CLV): CLV is the total revenue a business can expect from a single customer account throughout their relationship. Understanding CLV helps businesses identify the long-term value of acquiring and retaining customers.
- Retention Rate: This metric measures the percentage of customers who return to make additional purchases. A high retention rate suggests that customers are satisfied and loyal to the brand.
- Churn Rate: The churn rate indicates the percentage of customers who stop doing business with a company. Monitoring churn helps identify potential issues in customer experience or product offerings.
Traffic Metrics
- Source of Traffic: Understanding where your visitors are coming from (organic search, paid ads, social media, etc.) is essential for evaluating the effectiveness of marketing efforts.
- Bounce Rate: The bounce rate measures the percentage of visitors who leave after viewing only one page. A high bounce rate may indicate that the landing pages are not engaging enough or that visitors are not finding what they expected.
- Page Views: This metric indicates the total number of pages viewed by visitors. It helps assess content performance and user engagement.
Product Metrics
- Product Performance: Tracking which products are selling well and which are not helps in inventory management and promotional strategies. Analyzing product performance data can inform decisions about discounts, restocking, or discontinuing items.
- Inventory Levels: Keeping track of inventory ensures that popular products are always in stock and helps avoid overstocking. Monitoring inventory turnover rates can provide insights into product demand and sales efficiency.
- Return Rates: The percentage of products returned by customers can highlight issues related to product quality, sizing, or misleading product descriptions. High return rates may require investigation and adjustments to product offerings.
Tools for Tracking Ecommerce Data
With the right tools, tracking ecommerce data becomes streamlined and effective. Here are some of the best options available:
Google Analytics
Google Analytics is a powerful tool that provides in-depth insights into website traffic and user behavior. Here’s how to set up ecommerce tracking:
- Create a Google Analytics Account: If you haven’t already, create an account at Google Analytics.
- Set Up Ecommerce Tracking: Enable ecommerce tracking in the settings. This can be done by adding tracking code to your site or using a plugin if you’re on platforms like WordPress or Shopify.
- Link Google Ads: If you’re running paid advertising campaigns, linking Google Ads with your Google Analytics account allows you to track the performance of your ads in driving sales.
- Analyze Reports: Use various reports such as the Ecommerce Overview, Product Performance, and Sales Performance to gain insights. Familiarize yourself with the data visualization options available, such as funnel analysis and goal tracking.
- Use Enhanced Ecommerce Tracking: For a deeper understanding of customer interactions, enable Enhanced Ecommerce tracking. This feature provides insights into product impressions, clicks, and checkout behavior, allowing for a more granular analysis of the customer journey.
Ecommerce Platforms
Most ecommerce platforms come with built-in analytics features. Here are a few popular ones:
- Shopify: Offers detailed reports on sales, customers, and traffic. Shopify Analytics provides a user-friendly dashboard where you can monitor key metrics without needing advanced technical knowledge.
- WooCommerce: Integrates seamlessly with Google Analytics for enhanced tracking and reporting. WooCommerce also offers various plugins that can help you visualize your data better.
- Magento: Provides various reporting tools to analyze sales and customer behavior. Magento’s built-in reporting features enable you to generate reports on sales, customer demographics, and product performance.
Third-party Analytics Tools
Consider using third-party analytics tools to complement your tracking efforts:
- Kissmetrics: Focuses on customer behavior and conversion tracking. Kissmetrics provides detailed customer profiles, allowing you to track individual customer journeys and behaviors over time.
- Hotjar: Provides heatmaps and session recordings to visualize user interactions. Hotjar helps you understand how users navigate your site, where they click, and how they interact with your content.
- Mixpanel: Helps track user engagement and retention with in-depth analytics. Mixpanel offers event tracking and funnel analysis to understand how users interact with your site and products.
- Crazy Egg: Similar to Hotjar, Crazy Egg provides heatmaps, scroll maps, and A/B testing capabilities to analyze user behavior. This tool is beneficial for optimizing landing pages and improving user experiences.
Integrating Tracking Tools
Integrating multiple tools can provide a comprehensive view of your ecommerce data. Consider using APIs or plugins to connect your ecommerce platform with Google Analytics, email marketing tools, and customer relationship management (CRM) systems. This integration enables seamless data flow between platforms, making it easier to analyze and act on your data.
Implementing Data Tracking Strategies
To effectively track ecommerce data, it’s essential to have a well-defined strategy in place. Here are some key steps:
Setting Clear Goals
Before diving into data tracking, define what you want to achieve. Are you looking to increase sales, improve customer retention, or optimize marketing campaigns? Clear goals will guide your tracking efforts and help you determine which metrics are most relevant.
- Specific: Ensure your goals are specific and clearly defined. Instead of stating a general goal like “increase sales,” specify “increase sales by 20% in Q1.”
- Measurable: Set metrics that can quantify progress toward your goals. This makes it easier to assess whether you are on track to achieve your objectives.
- Achievable: Goals should be realistic and attainable based on your current resources and capabilities.
- Relevant: Align your goals with broader business objectives. Ensure that achieving these goals will contribute to the overall success of your ecommerce business.
- Time-bound: Set a timeline for achieving your goals. This creates a sense of urgency and helps keep you focused on results.
Creating a Data Collection Plan
Decide what data to collect based on your goals. This can include:
- Sales data from your ecommerce platform, including revenue, order volume, and average order value.
- Customer interaction data from your website analytics, including user behavior, traffic sources, and conversion rates.
- Marketing performance data from ad platforms and email campaigns, tracking click-through rates, conversion rates, and ROI.
Data Sampling: If you handle a large volume of transactions, consider implementing data sampling techniques. Sampling allows you to analyze a subset of data instead of the entire dataset, making analysis more manageable while still providing valuable insights.
Tracking Customer Journeys
Understanding the customer journey is crucial for identifying pain points and opportunities. Map out the different touchpoints customers encounter, from discovering your website to completing a purchase. This can include:
- Awareness: How do customers find your business? This can include search engine results, social media ads, or word-of-mouth referrals.
- Consideration: What factors influence their decision-making process? This includes product comparisons, reviews, and pricing.
- Purchase: What barriers do customers face during the checkout process? High cart abandonment rates may indicate issues with shipping costs, payment options, or website usability.
- Post-Purchase: How do customers engage with your brand after making a purchase? Monitoring repeat purchases, customer feedback, and return rates provides insights into customer satisfaction.
A/B Testing
Utilize tracking data to run A/B tests. By comparing two versions of a webpage or ad, you can determine which performs better. This helps optimize user experiences and improve conversion rates.
- Identify Elements to Test: Choose specific elements to test, such as headlines, calls-to-action, images, or layouts. Keep tests focused to isolate the impact of each change.
- Define Success Metrics: Before starting the test, establish clear metrics for success. This could be click-through rates, conversion rates, or bounce rates.
- Run the Test: Use tools like Google Optimize or Optimizely to run your A/B tests. Ensure that you have a large enough sample size to draw meaningful conclusions.
- Analyze Results: After the test period, analyze the results to determine which version performed better. Implement the winning variation and continue testing new elements over time.
Analyzing and Interpreting Ecommerce Data
Once you’ve collected the data, the next step is analysis. Here are some techniques and best practices:
Data Analysis Techniques
- Descriptive Analytics: This involves summarizing historical data to understand what has happened. Use dashboards and reports to visualize trends and patterns in your data.
- Predictive Analytics: This technique uses statistical models and machine learning to forecast future outcomes based on historical data. Predictive analytics can help identify potential customer behaviors and trends, enabling proactive decision-making.
- Prescriptive Analytics: This advanced form of analysis recommends actions based on data insights. For example, prescriptive analytics can suggest optimal pricing strategies or inventory management techniques.
- Cohort Analysis: Group customers into cohorts based on shared characteristics (e.g., purchase date, acquisition channel) and analyze their behavior over time. This approach provides insights into customer retention, lifetime value, and the effectiveness of marketing campaigns.
Turning Data into Actionable Insights
It’s not enough to just collect data; you must also interpret it to inform business decisions. For example, if you notice a high bounce rate on a specific product page, it might indicate that the page needs optimization.
- Customer Feedback: Combine data analysis with customer feedback to gain a deeper understanding of issues and opportunities. Surveys and reviews can provide qualitative insights that complement quantitative data.
- Competitor Analysis: Benchmark your performance against competitors to identify areas for improvement. Tools like SEMrush and SimilarWeb can help analyze competitor strategies and market positioning.
Visualizing Data
Visualizing data through charts and graphs can make insights more digestible. Use tools like Tableau, Google Data Studio, or Microsoft Power BI to create engaging reports that highlight key metrics and trends. Effective data visualization can enhance communication and understanding among team members and stakeholders.
- Dashboards: Create customized dashboards that present the most relevant data at a glance. Dashboards can help stakeholders quickly assess performance and identify areas for attention.
- Storytelling with Data: When presenting data, consider the narrative behind it. Use storytelling techniques to communicate insights effectively, helping your audience understand the implications of the data.
Common Challenges in Tracking Ecommerce Data
While tracking ecommerce data can provide significant benefits, there are challenges to consider:
Data Privacy Concerns
With regulations like GDPR and CCPA, ensuring customer data privacy is paramount. Make sure your tracking practices comply with these regulations to avoid penalties. This includes obtaining explicit consent for data collection and providing options for customers to opt-out.
- Transparency: Be transparent about your data collection practices. Inform customers about what data you collect and how it will be used.
- Security Measures: Implement robust security measures to protect customer data. Regularly update software, use encryption, and conduct security audits to minimize risks.
Data Overload
Collecting too much data can lead to analysis paralysis. Focus on key metrics that align with your business goals, and avoid drowning in irrelevant information. Use the following strategies to manage data overload:
- Data Filtering: Use filtering techniques to focus on the most relevant data. Create segments based on customer behaviors or demographics to narrow down your analysis.
- Prioritize Metrics: Identify which metrics are most important to your business goals. Regularly review and adjust your tracking strategy to ensure you’re focusing on the right data.
- Automate Reporting: Use automation tools to streamline reporting processes. This can help reduce the time spent on data analysis and allow you to focus on actionable insights.
Attribution Issues
Determining which channels contribute most to conversions can be complex. Utilize multi-touch attribution models to understand the customer journey better and allocate resources effectively.
- Single-Touch Attribution: This model assigns credit to one touchpoint, either the first or last interaction. While simple, it may not provide a complete picture of the customer journey.
- Multi-Touch Attribution: This approach distributes credit across multiple touchpoints, reflecting the customer’s entire journey. Use models like linear attribution or time decay attribution to gain a more comprehensive understanding of how different channels influence conversions.
- Attribution Tools: Consider using specialized attribution tools like HubSpot, Attribution, or Google Analytics Attribution to analyze the impact of various marketing channels on conversions.
Conclusion
Tracking ecommerce data is not just a technical requirement; it’s a strategic necessity for any online business aiming for success. By understanding what data to track, implementing effective strategies, and leveraging the right tools, businesses can gain valuable insights that drive growth.
In this guide, we explored the various dimensions of ecommerce data, key metrics to monitor, and best practices for data tracking. We also highlighted the challenges businesses may face and provided strategies to overcome them.
Ultimately, the goal of tracking ecommerce data is to foster a culture of data-driven decision-making. As you begin to implement these strategies, remember that the landscape of ecommerce is constantly evolving. Continuous learning and adaptation will be key to staying ahead of the competition.
Start tracking your ecommerce data today to unlock new opportunities, enhance your customer experience, and drive your business to new heights. If you found this guide helpful, consider subscribing to our newsletter for more insights on ecommerce strategies and best practices. Let’s take your ecommerce business to the next level!
Ready to start scraping Shopee data? Visit easydata.io.vn to learn more about our data scraping solutions and book a demo today!
Leave a Reply