

Shopee data analysis has become essential as Shopee grows into a promotion-heavy, highly fragmented marketplace. Price signals, category shifts, and competitive dynamics can no longer be understood through manual checks or isolated dashboards. This guide explores how to analyze Shopee data effectively, from core data types and analytical techniques to the role of tools in generating reliable marketplace insights.
What Is Shopee Data Analysis?
Shopee data analysis is often misunderstood as simple marketplace monitoring, but in practice it involves interpreting how products, sellers, and promotions interact over time.
Defining Shopee Data Analytics
Shopee data analytics refers to the process of transforming raw marketplace data into structured insights that support business decisions.
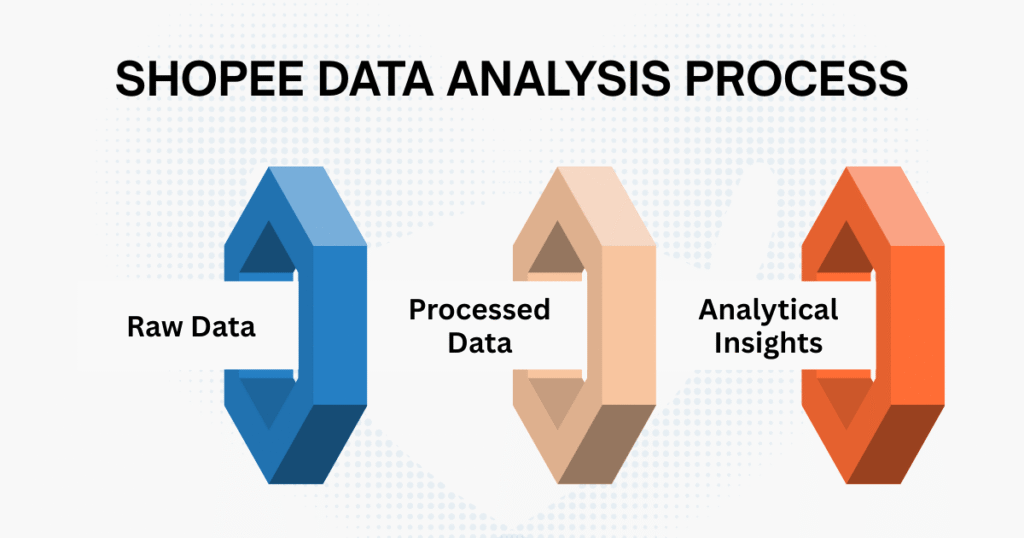
In practice, this involves working with multiple layers of data:
- Raw data: unprocessed information such as product listings, prices, seller details, and search visibility
- Processed data: cleaned and normalized datasets ready for analysis
- Analytical insights: conclusions derived from trends, comparisons, and patterns within the data
Effective Shopee data analytics is not about collecting data alone, but about systematically interpreting how the marketplace behaves over time.
How Shopee Data Differs from Other Marketplaces
Shopee’s data structure presents unique analytical challenges compared to other platforms.
- Shopee vs Amazon: Shopee is more fragmented at the seller level, with higher pricing volatility driven by promotions and seller competition.
- Shopee vs Lazada / TikTok Shop: Shopee relies heavily on campaigns, flash sales, and vouchers, which introduce short-term noise into pricing and demand signals.
These characteristics make Shopee data analytics more dependent on time-series analysis and contextual interpretation than simple snapshot comparisons.
Shopee Data Analysis vs Manual Marketplace Research
Manual marketplace research (such as browsing listings or checking competitors individually) can be useful for quick validation. However, it does not scale well when teams need:
- Coverage across thousands of SKUs
- Multi-category or multi-country visibility
- Historical comparisons over weeks or months
Snapshot-based analysis often leads to misleading conclusions, whereas Shopee data analytics enables consistent, repeatable insight generation.
Types of Shopee Data You Can Analyze
Shopee data analytics draws value from multiple data dimensions. Each data type answers a different set of questions, and meaningful analysis usually comes from combining them rather than viewing them in isolation.
| Data Type | Scope | Key Data Elements | Primary Analytical Use |
| Product and Assortment Data | Product listings and category structure | SKU coverage within categories; category and subcategory structure; attribute completeness and variation | Market mapping, assortment analysis, and category structure assessment |
| Pricing and Promotion Data | Pricing behavior and promotional mechanisms | Base price vs. discounted price; campaign, flash sale, and voucher effects; price dispersion across sellers | Price trend analysis, separation of structural pricing pressure from campaign-driven fluctuations |
| Seller and Brand Data | Seller and brand presence within categories | Seller density; brand presence and overlap; distribution of listings across top sellers | Competitive benchmarking, market concentration and competitive intensity analysis |
| Search and Visibility Data | Search behavior and marketplace visibility | Keyword rankings and visibility; top search terms by category; early indicators of emerging demand | Early demand detection, trend forecasting, and forward-looking market analysis |
Popular Tools for Analyzing Shopee Data
Tools help speed up access to Shopee data and surface patterns, but they only become useful when paired with clear analytical questions. In practice, many teams rely on dedicated Shopee analytics tools to monitor pricing behavior, seller competition, and visibility trends at scale.
Below are common tool categories that illustrate how different analytical needs are addressed.
- Price and Competitive Intelligence Tools
Tools such as Price2Spy focus on tracking competitor pricing, monitoring price movements, and identifying volatility across similar products or categories. They are particularly useful for observing pricing trends over time rather than relying on manual checks.
- All-in-One Seller Analytics Platforms
Platforms like SellerApp combine product research, keyword visibility, competitor monitoring, and performance dashboards. These tools are often used by sellers who need a centralized overview without building custom analytics pipelines.
- Advertising and Campaign Analytics Tools
Tools such as DataQ analyze advertising performance, audience targeting, and campaign efficiency on Shopee, helping teams interpret how promotional activity translates into visibility and conversions.
- Trend, Operations, and Engagement Analytics
Other tools address specific dimensions of Shopee data analytics:
- TrendMetrics focuses on detecting emerging product demand through search and listing signals
- PowerSell supports multi-channel performance and operational data
- Shoppertainment analyzes live-stream engagement and conversion behavior
- AiChat generates insights from customer interaction and automated support data
Putting Tools in Perspective
Each tool contributes partial insight into Shopee’s ecosystem, but none replaces structured analysis based on raw data and sound methodology. Effective Shopee data analytics depends on knowing when dashboards are sufficient and when deeper data exploration is required.
Learn more: AI Tools for Shopee Analytics to Boost E-commerce Success
Key Techniques for Analyzing Shopee Data
Shopee data analytics delivers value not through isolated metrics, but through how signals are interpreted across time, competitors, and market structure. The techniques below focus on reading marketplace behavior, rather than executing predefined workflows, helping analysts move from raw data to meaningful insight.
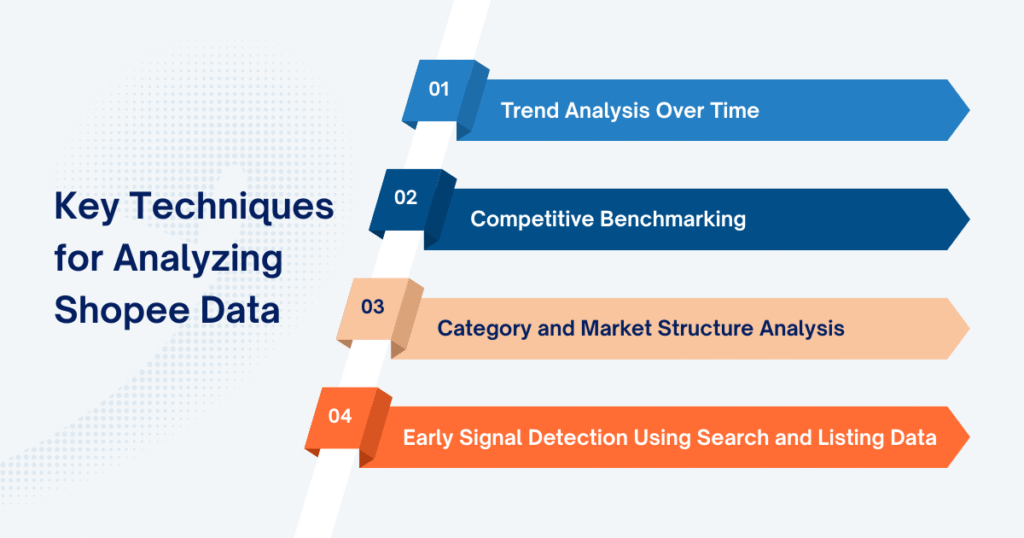
- Trend Analysis Over Time
At its core, trend analysis answers one critical question: is a change structural, or is it temporary?
On Shopee, where campaigns and promotions constantly distort short-term signals, analyzing data over time is essential.
Instead of observing prices or listings at a single moment, effective Shopee data analytics tracks how variables evolve across multiple periods. For example, a sudden price drop may appear alarming in isolation, but when viewed across several weeks, it may align with recurring campaign cycles rather than a true competitive shift.
Trend analysis is especially useful for:
- Distinguishing campaign-driven price fluctuations from long-term pricing pressure
- Identifying categories that consistently expand or contract over time
- Understanding whether growth is organic or artificially stimulated by promotions
By focusing on movement rather than snapshots, analysts gain a clearer picture of market direction.
- Competitive Benchmarking
Competitive benchmarking within Shopee data analytics is less about ranking winners and losers, and more about understanding relative positioning.
Rather than comparing a single seller against the entire market, meaningful benchmarking normalizes comparisons within the same category, price band, and promotion context. This helps answer questions such as:
- Which sellers maintain price stability despite heavy competition?
- How does a brand’s assortment depth compare to category norms?
- Are pricing gaps driven by strategy or by campaign participation?
For example, two sellers may list similar products at different prices, but deeper analysis often reveals differences in voucher usage, bundle strategies, or seller reputation. Shopee data analytics uncovers these nuances by comparing like-for-like conditions rather than surface-level metrics.
- Category and Market Structure Analysis
Market structure analysis shifts focus from individual products to the shape of the category itself.
Using Shopee data analytics, analysts can identify whether a category is:
- Highly concentrated, dominated by a small number of sellers
- Fragmented, with long-tail sellers contributing most listings
- Approaching saturation, where new listings add limited incremental value
This perspective is particularly important for strategic decisions. A category with rapid SKU growth but flat pricing may indicate early saturation, while a category with limited assortment but rising search interest may signal an emerging opportunity.
Understanding market structure allows teams to interpret performance data within its broader competitive context.
- Early Signal Detection Using Search and Listing Data
One of the most powerful aspects of Shopee data analytics is its ability to surface signals before they appear in sales figures.
Search and listing data often reflect demand formation earlier than transactions. Analysts frequently observe patterns such as:
- Rapid increases in keyword visibility without corresponding sales volume
- SKU expansion within niche subcategories before price stabilization
- Repeated search behavior around unmet product attributes
For instance, a spike in search visibility combined with limited listing coverage may indicate that demand is forming faster than supply. This gap between interest and availability is often an early indicator of future category growth.
By interpreting these signals correctly, Shopee data analytics enables teams to anticipate trends rather than react to them after the market has matured.
Bringing the Techniques Together
Individually, each technique reveals a specific aspect of marketplace behavior. Together, they form a cohesive analytical framework.
Trend analysis provides temporal context, competitive benchmarking clarifies relative positioning, market structure analysis defines the competitive landscape, and early signal detection highlights where attention should shift next. When applied collectively, these techniques allow Shopee data analytics to move beyond descriptive reporting and toward strategic insight.
Common Challenges in Shopee Data Analytics
Even with appropriate tools and methodologies, Shopee data analytics faces several recurring challenges:
- Data quality and normalization: Inconsistent SKU mapping and attribute variation across sellers can significantly weaken analytical accuracy.
- Platform volatility and campaign noise: Flash sales and vouchers distort short-term metrics, making it difficult to separate true market signals from promotional effects without longitudinal analysis.
- Scaling across markets: Differences between countries and inconsistent category taxonomies complicate cross-market analysis across Southeast Asia.
Final Thoughts
Shopee data analytics works best when treated as a strategic capability, not just a collection of tools or dashboards. High-quality insights depend on the quality of data, the techniques applied, and the questions being asked. Tools only deliver value when they support a well-defined analytical process.
As Shopee data analysis matures, many teams recognize that sustaining this foundation at scale is often more challenging than the analysis itself. Instead of managing every layer internally, organizations choose to combine in-house analytics with specialized support for data acquisition and structuring. Leveraging dedicated Shopee data scraping services allows analytics teams to reduce operational complexity, maintain data consistency over time, and focus their efforts on interpretation, decision-making, and long-term marketplace strategy.
Leave a Reply