
In the fast-evolving world of e-commerce, data is power. For Shopee sellers, mastering the platform’s analytics tools is crucial for optimizing store performance, improving customer experience, and increasing profits. Shopee analytics tools allow you to track key metrics such as sales, traffic, customer behavior, and ad performance, helping you make data-driven decisions to grow your business.
In this comprehensive guide, we’ll walk you through the step-by-step process of using Shopee analytics tools to maximize your store’s potential in 2024.
- 1. Why Shopee Analytics Matter for Sellers
- 2. Getting Started with Shopee Seller Center
- 3. Key Metrics to Track in Shopee Analytics
- 4. Advanced Shopee Analytics Tools
- 5. How to Use Shopee Ads Analytics
- 6. Leveraging Data Scraping for Deeper Insights
- 7. Practical Tips for Using Shopee Analytics Effectively
- 8. Conclusion: Growing Your Business with Shopee Analytics
1. Why Shopee Analytics Matter for Sellers
Shopee is one of Southeast Asia’s largest e-commerce platforms, hosting millions of buyers and sellers. To stand out in this competitive marketplace, sellers need more than just great products; they need data-driven insights. Shopee’s built-in analytics tools offer crucial information about your store’s performance, allowing you to monitor and adjust strategies in real-time.
Here’s why Shopee analytics is so important:
- Track Sales Performance: Understand how well your products are selling and identify trends.
- Optimize Marketing: Adjust campaigns based on ad performance and customer behavior.
- Improve Customer Experience: Analyze customer feedback and behavior to enhance satisfaction and loyalty.
- Stay Competitive: Analyze competitors’ strategies to ensure you’re offering competitive prices and promotions.
Now that you know why Shopee analytics is critical, let’s dive into how to use these tools effectively.
2. Getting Started with Shopee Seller Center
Shopee’s Seller Center is the platform’s core tool for managing and analyzing your store’s performance. It provides an easy-to-use interface for tracking sales, monitoring traffic, and managing orders.
a. Setting Up Shopee Analytics
To begin using Shopee analytics, log in to Shopee Seller Center. Once you’ve entered your dashboard, navigate to the “Business Insights” or “Data” tab where you’ll find your analytics tools. These include reports on sales, traffic, and customer activity.
b. Navigating the Dashboard
The dashboard gives you an at-a-glance view of your store’s key metrics, including:
- Sales Overview: A breakdown of total sales, orders, and revenue over selected time periods.
- Traffic Insights: Insights on page views, bounce rates, and where your traffic is coming from (e.g., organic vs. paid).
- Customer Behavior: Understand how long customers spend on your store, what products they browse, and conversion rates.
The dashboard also allows you to export data reports for deeper analysis. These reports can be downloaded in CSV format, making it easy to analyze data using tools like Excel or Google Sheets.
3. Key Metrics to Track in Shopee Analytics
Tracking the right metrics is crucial for making informed decisions. Below are the essential metrics you should monitor using Shopee analytics tools:
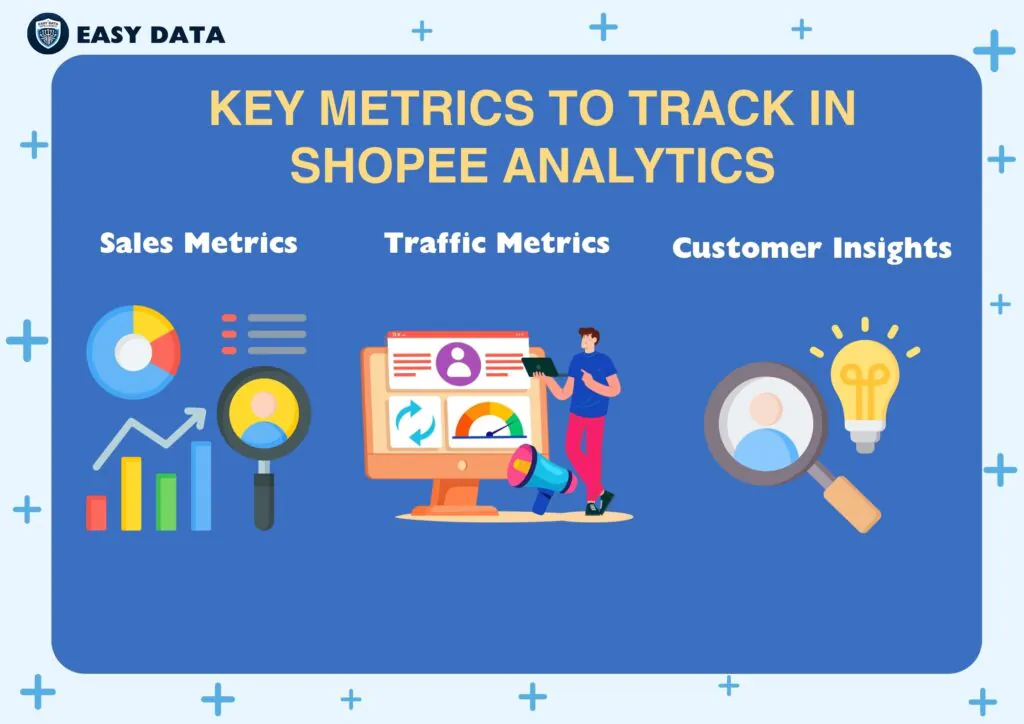
a. Sales Metrics
- Total Sales: Track your store’s total revenue over time.
- Average Order Value (AOV): This shows the average amount spent per transaction.
- Units Sold: Keep an eye on how many products you sell within a specified time frame.
- Conversion Rate: Measure the percentage of visitors who make a purchase.
b. Traffic Metrics
- Total Visitors: The total number of visitors to your store, segmented by time.
- Traffic Sources: See where your traffic is coming from—whether organic (SEO) or paid (ads).
c. Customer Insights
- New vs. Returning Customers: Understand customer loyalty by tracking how many buyers return to your store.
- Customer Lifetime Value (CLV): Estimate the total revenue a customer will generate over their lifetime.
- Cart Abandonment Rate: Track how many customers leave items in their cart without checking out.
By monitoring these metrics, you can quickly identify which areas need improvement and adjust your strategies accordingly.
4. Advanced Shopee Analytics Tools
While Shopee’s built-in analytics tools are powerful, integrating third-party solutions can offer deeper insights and more advanced features.
a. Google Analytics Integration
Google Analytics can be integrated with your Shopee store to track more detailed data about user behavior. You can analyze how users find your store, what products they’re most interested in, and how long they spend browsing.
Key Benefits:
- Comprehensive User Insights: Track users’ demographics, interests, and behavior patterns.
- Acquisition Channels: Understand which channels (organic, paid, social) are driving the most traffic.
- Custom Dashboards: Create personalized reports based on specific KPIs.
b. Power BI for Shopee Data Visualization
Power BI by Microsoft allows sellers to create visual reports and dashboards from their Shopee data.
Key Features:
- Data Visualization: Turn complex data into easy-to-read charts and graphs.
- Customizable Reports: Build reports tailored to your business needs.
- Cross-Platform Integration: Combine Shopee data with data from other sources for a full picture of your e-commerce performance.
c. Tableau for Custom Reporting
Tableau is another popular tool for creating custom visual reports. It’s known for its user-friendly interface and advanced analytics features, making it a favorite among e-commerce professionals.
Key Benefits:
- Interactive Dashboards: Analyze data with interactive charts and visualizations.
- Data Integration: Pull data from multiple platforms for comprehensive reporting.
- Advanced Analytics: Perform in-depth analysis on customer behavior and sales trends.
5. How to Use Shopee Ads Analytics
For sellers who rely on paid advertising, Shopee Ads Analytics is essential for tracking the performance of your ad campaigns. Shopee Ads Analytics provides insights into your campaign’s effectiveness, helping you optimize your ad spend.
Key Metrics to Monitor:
- Click-through Rate (CTR): Shows how often your ads result in clicks.
- Conversion Rate: Tracks how many clicks result in a sale.
- Return on Ad Spend (ROAS): Measures the revenue generated for every dollar spent on ads.
Using Shopee Ads Analytics allows you to continuously refine your campaigns to maximize ROI and improve ad performance.
6. Leveraging Data Scraping for Deeper Insights
For more advanced Shopee analytics, sellers can turn to data scraping. Data scraping tools extract raw data directly from Shopee, giving you access to deeper insights that may not be available through traditional analytics tools.
a. Easy Data
Easy Data is a platform that provides custom datasets based on your business needs. Unlike other scraping tools that require manual setup, Easy Data simplifies the process by delivering the exact data you need, such as pricing trends, competitor analysis, or customer behavior.
Key Benefits:
- Tailored Data: Request specific data and receive it in your preferred format.
- No Coding Required: Easy Data handles all the technical aspects of scraping.
- Real-time Data: Access up-to-date information to inform your decisions.
b. Other Data Scraping Tools
- Octoparse: A no-code scraping tool that helps sellers gather large datasets quickly.
- Scrapy: A Python-based tool for advanced users who need custom data extraction.
- Beautiful Soup: A Python library that simplifies data extraction from HTML and XML documents.
Data scraping tools allow sellers to gather in-depth insights into competitors, pricing, and customer trends, making them a powerful addition to any Shopee seller’s toolkit.
7. Practical Tips for Using Shopee Analytics Effectively
Here are some best practices for making the most of Shopee analytics:
- Set Clear Goals: Know what you want to achieve (e.g., increasing sales, improving conversion rates) before diving into the data.
- Regularly Review Metrics: Schedule time each week to analyze your store’s performance.
- Use Visualizations: Tools like Power BI and Tableau make it easier to spot trends and patterns in your data.
- Experiment with A/B Testing: Use analytics to test different strategies and see what works best for your store.
- Monitor Competitors: Regularly check competitor pricing and promotions to stay ahead of the market.
8. Conclusion: Growing Your Business with Shopee Analytics
Mastering Shopee analytics tools is essential for scaling your business in 2024. Whether you’re using the built-in features in Shopee Seller Center or advanced tools like Power BI, Tableau, or Easy Data, the key is to stay data-driven. By understanding your sales, traffic, and customer behavior, you can make informed decisions that drive growth, optimize ad spend, and improve customer satisfaction.
Start using Shopee analytics today, and watch your business grow with every data-driven decision.
Ready to start scraping Shopee data? Visit easydata.io.vn to learn more about our data scraping solutions and book a demo today!
Leave a Reply