
In today’s hyper-competitive e-commerce landscape, data isn’t just a nice-to-have—it’s essential for survival. The sheer volume of data available to online businesses is staggering, but making sense of it all is a different challenge. That’s where e-commerce metrics come into play.
E-commerce metrics give you insights into your business’s performance, from the effectiveness of your marketing campaigns to the profitability of your products and the behavior of your customers. By understanding these key metrics, you’ll be in a better position to make informed decisions, drive growth, and optimize every aspect of your online store.
In this article, we’ll explore the most important e-commerce metrics, explain how to calculate them, and provide strategies for improving each one. Whether you’re just starting or you’re an experienced e-commerce business owner, this guide will help you refine your approach to data and analytics.
What Are E-commerce Metrics?
E-commerce metrics are data points that measure different aspects of your online store’s performance. These metrics provide insights into customer behavior, marketing effectiveness, sales trends, and the overall health of your business. With the right data, you can identify areas of strength, pinpoint problems, and refine your strategy for optimal results.
Why Are E-commerce Metrics Important?
Metrics help you understand what’s happening behind the scenes of your e-commerce store. They enable you to make better decisions, predict future outcomes, and continuously optimize your business processes. Some of the key reasons why e-commerce metrics are crucial include:
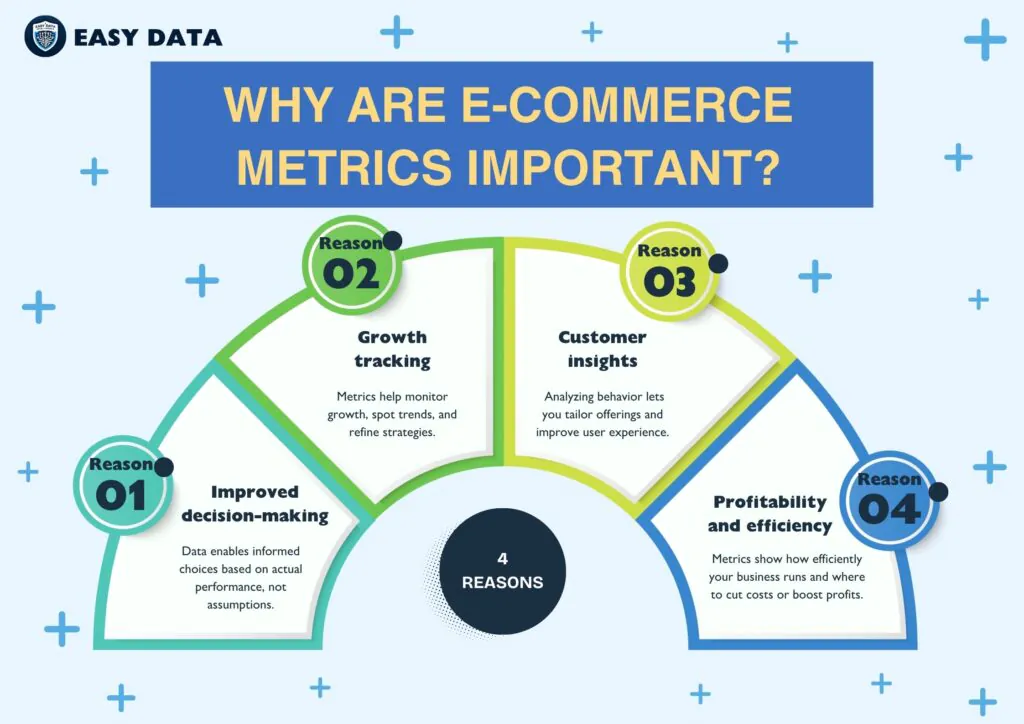
- Improved decision-making: Accurate data helps you make informed decisions based on actual performance rather than gut feelings or assumptions.
- Growth tracking: Metrics allow you to monitor your store’s growth, understand trends, and adjust your strategies accordingly.
- Customer insights: By analyzing customer behavior, you can tailor your offerings, improve user experience, and boost satisfaction.
- Profitability and efficiency: Metrics reveal how efficiently your business is operating and where you can cut costs or maximize profits.
Now, let’s dive into the top e-commerce metrics you should be tracking to ensure the success of your online store.
1. Conversion Rate (CR)
What is Conversion Rate?
Conversion rate is the percentage of visitors to your website who take a specific desired action, such as making a purchase, signing up for a newsletter, or downloading a resource. In the context of e-commerce, conversion rate usually refers to the percentage of visitors who complete a purchase.
Why is Conversion Rate Important?
The conversion rate is one of the most critical metrics for any online store because it directly affects your revenue. If your conversion rate is low, you’re losing out on potential sales, even if you’re attracting a high volume of traffic. Increasing your conversion rate allows you to make more money from your existing traffic, without needing to invest in acquiring new customers.
A higher conversion rate means that your website and marketing strategies are effectively encouraging visitors to complete purchases. By optimizing your conversion rate, you can significantly boost profitability.
How to Calculate Conversion Rate
Conversion Rate=(Number of ConversionsNumber of Visitors)×100\text{Conversion Rate} = \left( \frac{\text{Number of Conversions}}{\text{Number of Visitors}} \right) \times 100Conversion Rate=(Number of VisitorsNumber of Conversions)×100
For example, if 5,000 people visit your website in a month and 200 of them make a purchase, your conversion rate is 4%.
Tips to Improve Conversion Rate
- Enhance user experience: Ensure your website is easy to navigate, fast to load, and mobile-friendly. Use high-quality images and provide detailed product descriptions.
- Simplify the checkout process: Reduce the number of steps required to complete a purchase, and offer guest checkout options to minimize friction.
- Leverage social proof: Show customer reviews, testimonials, and user-generated content to build trust and credibility.
- Use urgency and scarcity tactics: Limited-time offers or low-stock notifications can encourage hesitant buyers to complete their purchases.
Conversion Rate Benchmarks
While conversion rates vary significantly across industries, the average e-commerce conversion rate is typically between 2% and 3%. However, top-performing stores often achieve conversion rates of 5% or higher. Regularly benchmarking your performance against competitors can help set realistic goals.
2. Average Order Value (AOV)
What is Average Order Value?
Average Order Value (AOV) is a metric that tracks the average amount of money customers spend per transaction. It’s an important metric because it helps you understand customer purchasing behavior and allows you to strategize ways to increase revenue from each customer.
Why is AOV Important?
Increasing AOV means that customers are spending more on each transaction, which can have a significant impact on your overall revenue. By focusing on this metric, you can boost profits without necessarily having to acquire new customers, which can be costly.
A higher AOV also allows you to offset marketing and operational costs, maximizing the return on investment for each sale.
How to Calculate Average Order Value
AOV=Total RevenueNumber of Orders\text{AOV} = \frac{\text{Total Revenue}}{\text{Number of Orders}}AOV=Number of OrdersTotal Revenue
For example, if your total revenue for a month is $100,000 and you processed 2,000 orders, your AOV is $50.
Strategies to Increase AOV
- Offer product bundles: Group related items together and offer them at a discounted rate to encourage customers to buy more in one transaction.
- Upsell and cross-sell: Suggest premium versions or complementary products at checkout to increase the value of the cart.
- Free shipping thresholds: Offer free shipping for orders over a certain amount, incentivizing customers to spend more to qualify.
- Create tiered discounts: Offer increasing discounts as customers add more items to their cart, such as “Buy 3, get 20% off.”
AOV Benchmark
Average Order Value varies significantly by industry, product, and region. For example, luxury goods and electronics typically have a much higher AOV than lower-cost goods like apparel or groceries. Understanding your industry’s AOV can help you set realistic targets and benchmarks for improvement.
3. Cart Abandonment Rate
What is Cart Abandonment Rate?
Cart abandonment rate is the percentage of shoppers who add products to their cart but leave your website without completing the purchase. This metric is a key indicator of potential issues with the checkout process or customer concerns about pricing, shipping, or website usability.
Why is Cart Abandonment Rate Important?
Cart abandonment is one of the biggest challenges faced by online retailers. Research shows that the global average cart abandonment rate hovers around 70%, meaning that a large percentage of potential customers leave without completing their purchase. Every abandoned cart represents lost revenue, so reducing this rate can lead to significant financial gains.
How to Calculate Cart Abandonment Rate
Cart Abandonment Rate=(Number of Abandoned CartsNumber of Initiated Transactions)×100\text{Cart Abandonment Rate} = \left( \frac{\text{Number of Abandoned Carts}}{\text{Number of Initiated Transactions}} \right) \times 100Cart Abandonment Rate=(Number of Initiated TransactionsNumber of Abandoned Carts)×100
For example, if 500 customers begin the checkout process but only 150 complete their purchase, your cart abandonment rate is 70%.
Common Causes of Cart Abandonment
- Unexpected costs: Hidden fees, taxes, or high shipping costs can cause customers to abandon their cart.
- Complicated checkout process: A lengthy or confusing checkout process can lead to frustration and abandonment.
- Mandatory account creation: Forcing customers to create an account before purchasing can deter first-time buyers.
- Lack of trust: A lack of visible security features or customer reviews can make customers hesitant to complete a purchase.
How to Reduce Cart Abandonment Rate
- Offer transparent pricing: Clearly display all costs, including taxes and shipping, upfront to avoid surprises at checkout.
- Simplify the checkout process: Use a one-page checkout or reduce the number of steps required to complete a purchase.
- Provide guest checkout: Allow customers to make purchases without creating an account, removing a barrier to conversion.
- Implement exit-intent popups: Use popups that appear when a customer is about to leave the site, offering discounts or reminders to complete their purchase.
Cart Abandonment Rate Benchmarks
The average cart abandonment rate varies by industry. For example, sectors like travel and retail typically experience higher abandonment rates due to comparison shopping or complex booking processes. However, reducing cart abandonment by even a few percentage points can result in substantial revenue gains.
4. Customer Lifetime Value (CLV)
What is Customer Lifetime Value?
Customer Lifetime Value (CLV) represents the total revenue a business can expect to earn from a single customer throughout their relationship with the company. CLV is a forward-looking metric that helps businesses understand how much a customer is worth over time, taking into account repeat purchases and customer loyalty.
Why is CLV Important?
CLV is crucial for understanding the long-term profitability of your customer base. If you can accurately predict how much revenue a customer will generate over their lifetime, you can make smarter decisions about how much to invest in customer acquisition and retention strategies.
How to Calculate Customer Lifetime Value
There are several ways to calculate CLV, but a simple formula is:
CLV=AOV×Purchase Frequency×Customer Lifespan\text{CLV} = \text{AOV} \times \text{Purchase Frequency} \times \text{Customer Lifespan}CLV=AOV×Purchase Frequency×Customer Lifespan
For instance, if your average customer spends $50 per order, makes two purchases per year, and remains a customer for five years, their CLV would be $500.
Strategies to Increase CLV
- Create a loyalty program: Reward repeat customers with discounts, exclusive offers, or points they can redeem for future purchases.
- Offer subscription services: Introduce subscription-based products or services that encourage customers to make regular purchases.
- Personalized marketing: Use customer data to send targeted emails or product recommendations based on their purchase history.
- Exceptional customer service: Ensure your customer service team is responsive and helpful, as a great customer experience can lead to repeat purchases.
CLV Benchmark
CLV varies by industry and product type. In industries with high customer acquisition costs (CAC), such as luxury or B2B e-commerce, CLV plays a critical role in determining profitability. Regularly reviewing and improving CLV can have a significant impact on the long-term success of your business.
5. Customer Acquisition Cost (CAC)
What is Customer Acquisition Cost?
Customer Acquisition Cost (CAC) refers to the amount of money spent on marketing, advertising, and sales to acquire a new customer. This includes everything from digital ads and social media campaigns to email marketing and sales team salaries.
Why is CAC Important?
CAC is essential for understanding how efficiently your business is attracting new customers. If your CAC is too high relative to your revenue per customer, you’ll struggle to achieve long-term profitability. Balancing CAC with CLV is key to maintaining sustainable growth.
How to Calculate Customer Acquisition Cost
CAC=Total Marketing and Sales CostsNumber of New Customers Acquired\text{CAC} = \frac{\text{Total Marketing and Sales Costs}}{\text{Number of New Customers Acquired}}CAC=Number of New Customers AcquiredTotal Marketing and Sales Costs
For example, if you spend $20,000 on marketing in a month and acquire 200 new customers, your CAC is $100 per customer.
Strategies to Reduce CAC
- Focus on organic traffic: Invest in search engine optimization (SEO) and content marketing to attract visitors without paying for ads.
- Leverage user-generated content: Encourage customers to share reviews, photos, and testimonials to build trust and attract new customers at little to no cost.
- Improve targeting: Use data and analytics to refine your marketing campaigns, ensuring that you’re reaching the right audience with the right message.
- Referral programs: Encourage existing customers to refer new ones by offering incentives, such as discounts or credits.
CAC Benchmark
CAC varies widely depending on the industry and marketing channels used. Businesses with a high CAC often rely on customer retention and repeat purchases to offset the initial acquisition cost. Tracking and optimizing CAC over time can help you strike the right balance between customer acquisition and long-term profitability.
6. Return on Ad Spend (ROAS)
What is Return on Ad Spend?
Return on Ad Spend (ROAS) is a metric that measures the effectiveness of your advertising campaigns by comparing the revenue generated to the amount spent on ads. It helps you understand whether your ads are delivering a positive return on investment.
Why is ROAS Important?
ROAS is a critical metric for determining the success of paid advertising campaigns. If you’re not generating enough revenue from your ads, you may be wasting money on ineffective campaigns. A positive ROAS indicates that your ads are profitable, while a negative ROAS suggests that adjustments are needed.
How to Calculate ROAS
ROAS=Revenue from AdsCost of Ads\text{ROAS} = \frac{\text{Revenue from Ads}}{\text{Cost of Ads}}ROAS=Cost of AdsRevenue from Ads
For example, if you spend $5,000 on Google Ads and generate $20,000 in revenue, your ROAS would be 4:1, meaning you earned $4 for every $1 spent.
Strategies to Improve ROAS
- A/B test ad creatives: Experiment with different ad copy, visuals, and calls-to-action to find the most effective combination.
- Refine targeting: Use audience segmentation and lookalike audiences to ensure your ads are reaching the most relevant customers.
- Optimize landing pages: Ensure that the landing pages you send traffic to are optimized for conversions, with clear messaging and a strong CTA.
- Use retargeting campaigns: Show ads to users who have previously visited your site or engaged with your content to encourage them to return and complete a purchase.
ROAS Benchmark
A “good” ROAS depends on your industry, product margins, and advertising platform. However, a ROAS of 3:1 or higher is generally considered healthy for most e-commerce businesses. Tracking ROAS across different campaigns and platforms can help you allocate your advertising budget more effectively.
7. Bounce Rate
What is Bounce Rate?
Bounce rate is the percentage of visitors who leave your website after viewing only one page. They do not interact further with the site or visit additional pages. A high bounce rate typically indicates that visitors aren’t finding what they’re looking for or are having a poor experience on your website.
Why is Bounce Rate Important?
Bounce rate is a critical metric for assessing user engagement. If a large percentage of your visitors are leaving after viewing just one page, it suggests that something is wrong—whether it’s slow load times, poor content, or irrelevant traffic. A lower bounce rate generally indicates that your site is engaging and encourages visitors to explore more.
How to Calculate Bounce Rate
Bounce rate is calculated automatically by most analytics tools, but here’s the basic formula:
Bounce Rate=(Single-page SessionsTotal Sessions)×100\text{Bounce Rate} = \left( \frac{\text{Single-page Sessions}}{\text{Total Sessions}} \right) \times 100Bounce Rate=(Total SessionsSingle-page Sessions)×100
For example, if 1,000 people visit your website in a month and 600 of them leave after viewing only one page, your bounce rate is 60%.
Common Causes of High Bounce Rate
- Slow website loading times: Slow page speed can frustrate users, leading them to leave without exploring further.
- Poor mobile optimization: If your site isn’t optimized for mobile devices, visitors may have difficulty navigating or reading content.
- Irrelevant traffic: If your ads or content are attracting the wrong audience, visitors may leave quickly after realizing your site isn’t what they were looking for.
How to Reduce Bounce Rate
- Improve page load speed: Use tools like Google PageSpeed Insights to identify and fix issues that may be slowing down your website.
- Enhance mobile experience: Ensure your site is fully responsive and provides a seamless experience on all devices.
- Create engaging content: Provide high-quality, relevant content that answers visitors’ questions and encourages them to explore further.
- Use internal linking: Guide visitors to other relevant pages on your site through internal links, keeping them engaged and reducing bounce rate.
Bounce Rate Benchmark
Bounce rates vary depending on the type of website and industry. For example, content-heavy sites may have higher bounce rates than e-commerce sites. A bounce rate of 40% to 60% is generally considered average for most e-commerce websites. Tracking your bounce rate over time can help you identify areas where your site needs improvement.
Conclusion
E-commerce metrics are the foundation of data-driven decision-making. By tracking and analyzing key metrics such as conversion rate, AOV, cart abandonment rate, CLV, CAC, ROAS, and bounce rate, you can gain deep insights into your online store’s performance. Each metric provides a unique view of your business, helping you identify areas for improvement, optimize marketing efforts, and ultimately, drive more sales.
Remember, the key to successful e-commerce is not just collecting data but knowing how to interpret it and act upon it. Regularly monitor these metrics, set benchmarks, and adjust your strategies accordingly. Over time, this approach will lead to a more profitable, sustainable online business.
By focusing on these core metrics and continuously optimizing your performance, you’ll be well on your way to e-commerce success.
Ready to start scraping Shopee data? Visit easydata.io.vn to learn more about our data scraping solutions and book a demo today!
Leave a Reply