


The eCommerce industry is evolving at a rapid pace, fueled by technological advancements, shifting consumer behaviors, and digital transformation. Whether you’re a business owner, marketer, or investor, understanding eCommerce growth statistics can help you make informed decisions and stay ahead of the competition.
This guide explains historical eCommerce benchmarks relevant to 2025 planning, with each figure tied to its reporting period and scope. Sources were rechecked on October 2, 2026. These are dated releases, not live market estimates; forecasts and subsequently revised figures are identified below.
Global eCommerce Growth Statistics
1. The Expanding eCommerce Market
UNCTAD’s 2024 business e-commerce report estimated almost US$27 trillion in business e-commerce sales in 2022 across 43 economies, about 10% above 2021. This broad measure includes business-to-business transactions; it is not the size of worldwide consumer online retail. Specify whether a market estimate covers business sales, consumer retail or a platform’s gross merchandise value (GMV) before using it in a forecast.
2. Mobile Commerce: A U.S. Holiday Benchmark
Adobe’s January 7, 2025 holiday report found that smartphones accounted for 54.5% of online transactions during November 1–December 31, 2024 in its U.S. retail analysis. This is a holiday-period benchmark from Adobe Analytics, not the mobile share of all worldwide transactions for the full year. Compare it with your own mobile checkout completion rate and order mix before assigning a mobile sales target.
3. eCommerce Market Share in Retail
The U.S. Census Bureau’s February 19, 2025 release initially estimated that e-commerce represented 16.1% of U.S. retail sales in 2024. This is a U.S. retail-sales share, not a global share. Revision note: the archived report states that its estimates were revised on April 25, 2025 and are no longer the most up to date. Retain this value only when describing that historical release; use the Census e-commerce series for a new analysis.
Key eCommerce Trends Driving Growth
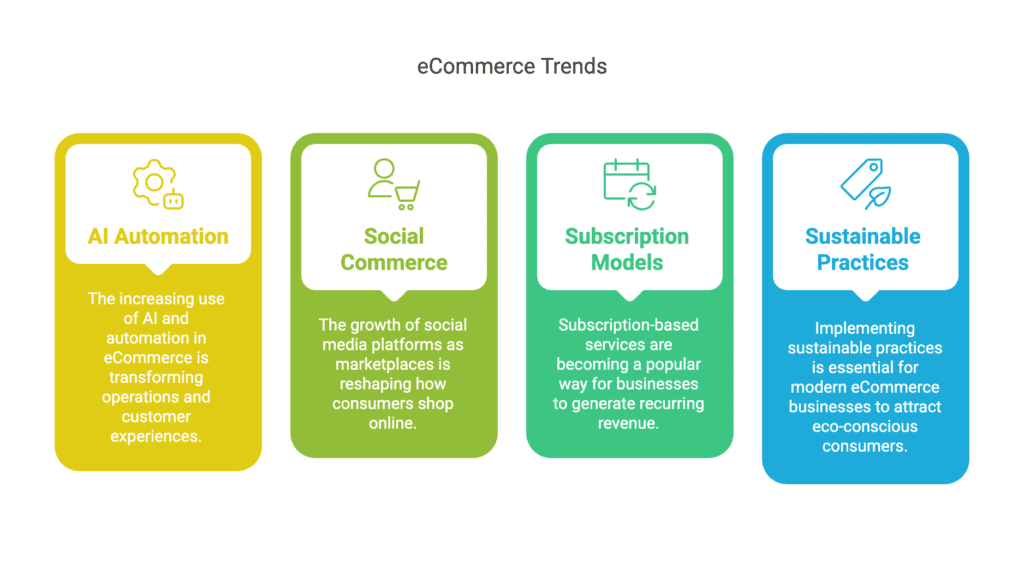
4. Rise of AI and Automation
AI and automation can support tasks such as classifying product information, routing support questions and reviewing inventory signals. Treat each use as a testable project: define an error rate, human review step and business outcome before deployment. A tool’s presence does not establish a conversion improvement. For collecting market observations, document source coverage and collection limits as described in our ecommerce data collection guide.
5. Social Commerce Expansion
The Google, Temasek and Bain e-Conomy SEA 2024 release reported video commerce at 20% of e-commerce GMV within its Southeast Asian coverage. Video commerce and all social commerce are not interchangeable categories. When evaluating a channel, record where checkout occurs, which orders are attributed to it, and the costs of content, commissions, promotions and returns.
6. Subscription-Based Models
Subscriptions can suit products with recurring demand, but a membership fee and a recurring product order are different business models. Assess paid renewals, cancellations, refunds and contribution margin by signup cohort. Define churn using the same eligible customer population and time window each month; do not assume a market-wide growth forecast predicts the performance of a particular subscription offer.
7. Sustainable eCommerce Practices
Evaluate packaging and sourcing choices using evidence from your own operations: material used per fulfilled order, damage and return rates, supplier documentation and delivery costs. A stated shopping preference is not the same as a completed purchase. Describe environmental claims precisely and disclose how they were measured instead of attaching an unsupported universal preference percentage.
Regional eCommerce Growth Insights
| Coverage | Measure and period | Interpretation |
|---|---|---|
| United States | Retail e-commerce sales, 2024 | Historical Census release; subsequently revised. Not all North America. |
| Six Southeast Asian markets | E-commerce GMV, 2024 projection | Forecast, not final sales or platform revenue; not all Asia-Pacific. |
| European Union | Internet users buying online in the prior 12 months, 2024 survey | Shopper participation, not transaction value or cross-border share. |
8. United States: A Historical Retail Estimate
For the United States, the February 19, 2025 Census release initially put full-year 2024 retail e-commerce sales at US$1,192.6 billion, up 8.1% from 2023. These figures belong to that archived release and were subsequently revised, as noted above. They do not describe all North America. Keep geography, release version and the treatment of prices consistent when comparing annual growth.
9. Southeast Asia: Six-Market GMV Projection
The November 5, 2024 e-Conomy SEA release projected US$159 billion in 2024 e-commerce GMV across Indonesia, Malaysia, the Philippines, Singapore, Thailand and Vietnam. It was a projection published before year-end, not a final audited sales total. Those six markets are a subset of Asia-Pacific; the estimate does not establish their share of worldwide online retail. GMV also differs from platform revenue and merchant profit. For a later comparison, see our 2025 Southeast Asia ecommerce market table, which separates ecommerce GMV from the broader digital economy. For a country-specific planning example, use the Philippines market pilot worksheet to define products, buying routes, delivery checks and costs.
10. European Union: Online Shopping Participation
Eurostat’s February 20, 2025 release reported that 77% of EU internet users bought or ordered goods or services online for personal use in the previous 12 months in its 2024 survey. This is a measure of people participating in online shopping, not the percentage of transactions placed internationally. A cross-border strategy needs a separate measure of buyer and seller locations, delivery cost and returns for the target countries.
Strategies for Scaling Your eCommerce Business
Translate market context into a measurable business question. Our ecommerce market analysis guide explains how to separate demand indicators, competitive observations and your own results. Use comparable periods and definitions before setting a target.
Fictional calculation example: a store’s revenue rises from US$100,000 to US$120,000 over comparable periods. Growth is (120,000 − 100,000) ÷ 100,000 × 100 = 20%. If its online share rises from 15% to 18%, that is 3 percentage points, also a 20% relative increase in the share. These invented figures explain the calculation; they are not market statistics or Easy Data customer results. Check whether taxes, refunds, currency changes and price changes affect the comparison.
- Optimize for Mobile: Test product discovery, forms and checkout on small screens, then compare completion rates by device using consistent consent and measurement settings.
- Validate Analytics and Automation: Check data quality, permissions and error rates before using automated output to make pricing or marketing decisions.
- Connect Channels Carefully: Align product identifiers, stock definitions and return policies before combining online and offline reports.
- Test Social Commerce: Run a defined channel experiment and compare confirmed orders and contribution margin, not just views or clicks.
- Measure Customer Experience: Track delivery accuracy, support resolution, returns and repeat purchases before claiming improved loyalty.

Conclusion
Use eCommerce growth statistics as context, then test decisions against your own customers, costs and fulfillment results. Save the source, release date, geography, denominator and estimate status alongside every benchmark. Do not combine business sales, GMV, retail-sales shares and shopper participation into a single regional ranking.
For more insights on data-driven eCommerce solutions, visit EasyData.io.vn.
Leave a Reply